Light curves
In astronomy, a light curve is a graph of light intensity of a celestial object as a function of time, typically with the magnitude of light received on the y axis and with time on the x axis. Siril is able to generate such curves when analysing stars.
There are now two ways of selecting the variable and references (also called comparison) stars: manually, or using a list of stars obtained by the N.I.N.A. exoplanet plugin.
Manual star selection
Start by switching to the Photometry Mode (click on  ).
).
Select (right click) the variable star followed by the comparison stars you wants, as explained here.
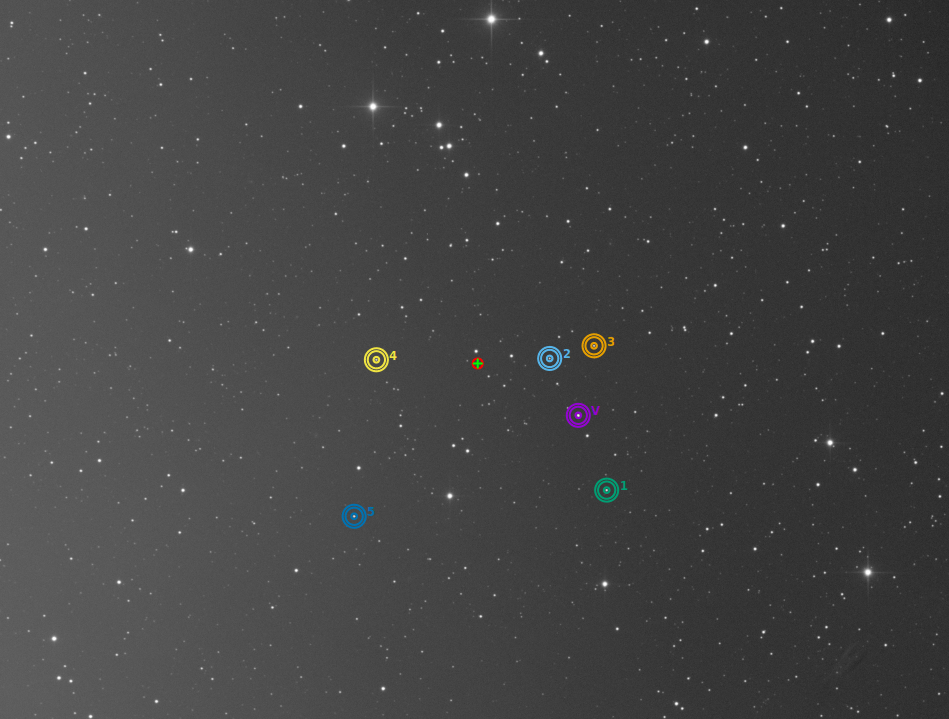
One star is the variable (purple with a V) and the 5 others are used as references.
Warning
Make sure to not select variable stars for references. If the astrometry is done on your image, do not hesitate to use the SIMBAD request to know more about the stars.
One handy way to check your comparison star is to display the 3 variable catalogues related to variable stars: GCVS, AAVSO-VSX and GAIA-varisum.
You have to set your own parameter (limit magnitude), but as an example, here are the commands:
conesearch 18.0 -cat=gcvs
conesearch 18.0 -cat=aavso_chart
conesearch 18.0 -cat=varisum
Tip
It is preferable to choose references whose magnitude is close to that of the variable as explained later here.
Once done, Siril automatically loads the Plot tab as shown in the figure below. This shows FWHM curves expressed as a function of frame number.
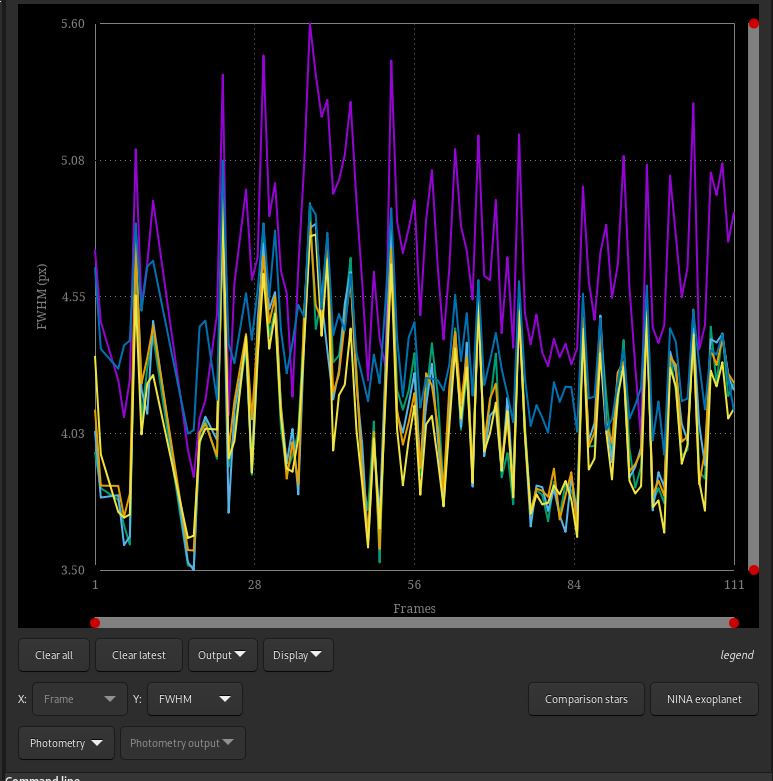
The plot tab as showed right after the quick photometry on sequence.
What interests us in this part is to display the magnitude curves. Simply go to the drop-down menu and change FHWM to Magnitude. The magnitude curves of each analyzed star are then displayed. The submenus located in Photometry of the Tools menu are also sensitive.
Saving the selected comparison stars
When satisfied with the comparison stars set, one can to save them for future use in an Automated Light Curve process or just keep a trace for further documentation.
Select .
The default Use the stars in the currently loaded image is selected.
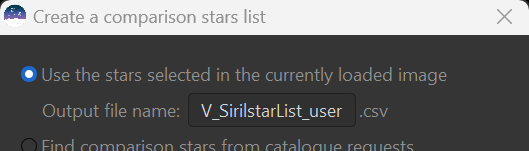
Saving the hand selected stars in a .csv file.
The default output file name will be V_SirilstarList_user.csv but you can
change it according to your convenience.
After you click OK, the file will be created and saved in your current working directory.
Light Curve (ETD format)
The button Light Curve (ETD format), located in the menu is dedicated to exoplanet transit data, producing a file in the format managed by the ETD website.
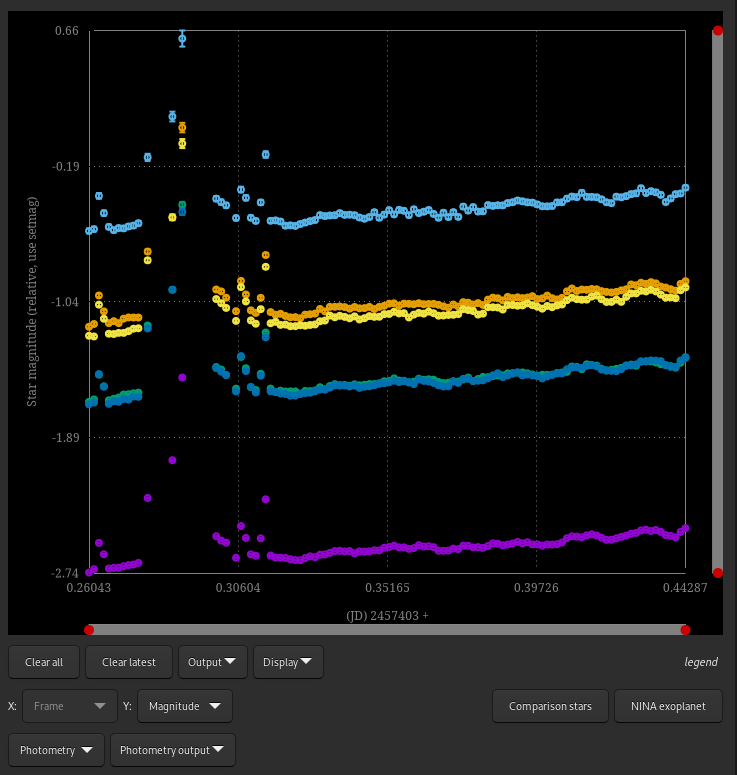
Switching to magnitude view make the Photometry output button sensitive.
Once the analysis is completed with a number of reference stars of at least 4
or 5 (the higher the number, the more accurate the result. However, a maximum
number of 19 stars is allowed). Siril will ask for a file name to save the data
in csv format, then the light curve will be displayed in a new window.
#JD_UT (+ 2457403)
# JD_UT V-C err
2457403.260428 -1.01054 0.00468598
2457403.261956 -1.00321 0.0046727
2457403.263461 -1.00132 0.00540513
2457403.264977 -0.994067 0.00505492
2457403.266481 -1.00397 0.00465623
2457403.267998 -1.00532 0.00467666
...
This is a 3-column file. The first 2 lines, starting with a "#", are comments. Then, the first column is the precise time of observation in Julian Date format. The second column is the magnitude of the variable (\(V\)), from which the sum of the instrumental magnitudes of the comparison stars has been subtracted. The third column represents magnitude uncertainties.
Theory
\(V\) is given by the following formula:
with
\(N\) is the total number of comparison stars and \(C_\text{ins},i\) is the instrumental magnitude of i-th star in the ensemble.
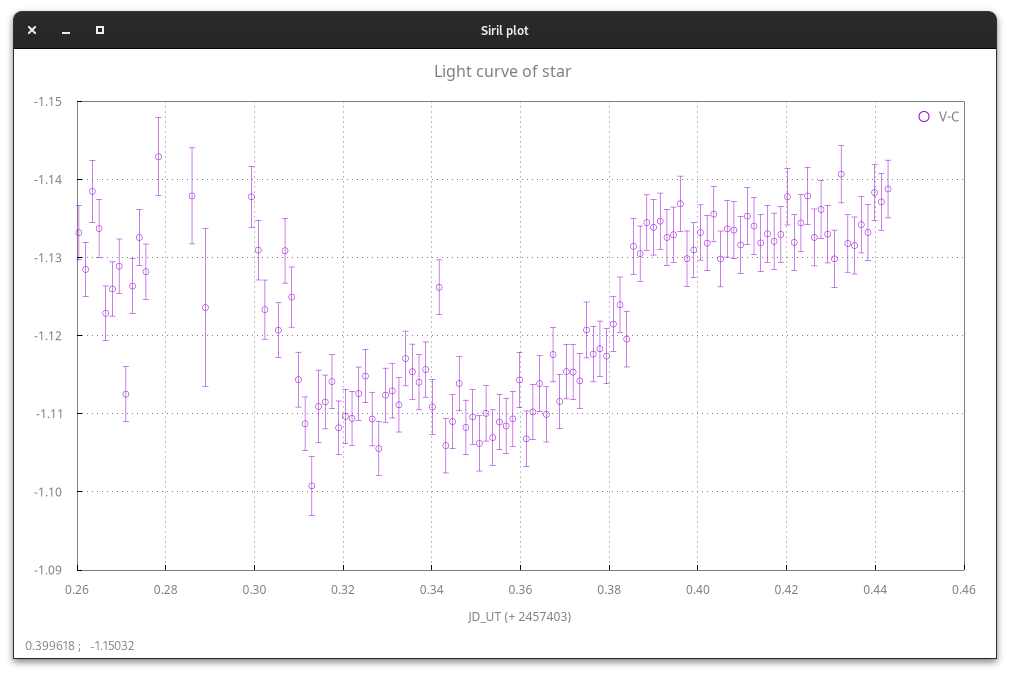
Light curve of an exoplanet transit.
Tip
The light curve is drawn with Siril internal plotting tool. Refer to its documentation for more detailed instructions on its use.
AAVSO extended file format
Located in the menu , the button, AAVSO file format, is dedicated to the AAVSO extended file format for variable stars. This opens a new dialog, which once completed, exports a csv file that can be uploaded to the dedicated website.
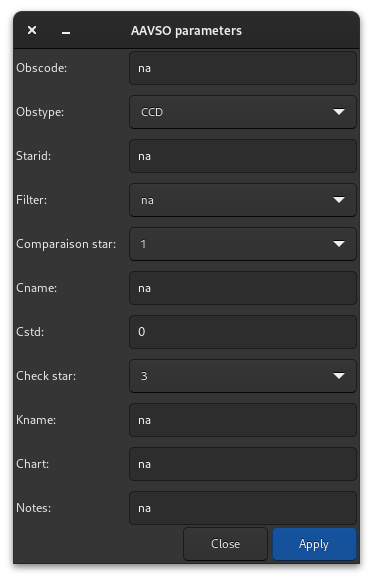
AAVSO parameters dialog. This dialog is used to fill the AAVSO extended file. More information are found at the AAVSO website
Theory
In Siril, the AAVSO file format exported uses the standardized magnitude defined as:
where \(V_\text{ins}\) and \(C_\text{ins}\) are the instrumental magnitude of the variable and the comparison, respectively, and \(C_\text{std}\) is the chart magnitude for the comparison. You can specify \(C_\text{std}\) value in the AAVSO parameters dialog, before export.
An example of photometry is given below with the star Rx And. This star has great variability: its magnitude varies from 10.2 to 15.1 with a periodicity of about 13 days. After processing in Siril, taking a comparison star and a check star, we obtain the following AAVSO curve after data upload. The new data are on the far right (taken on November 24 and 25, 2023) and are shown in green.
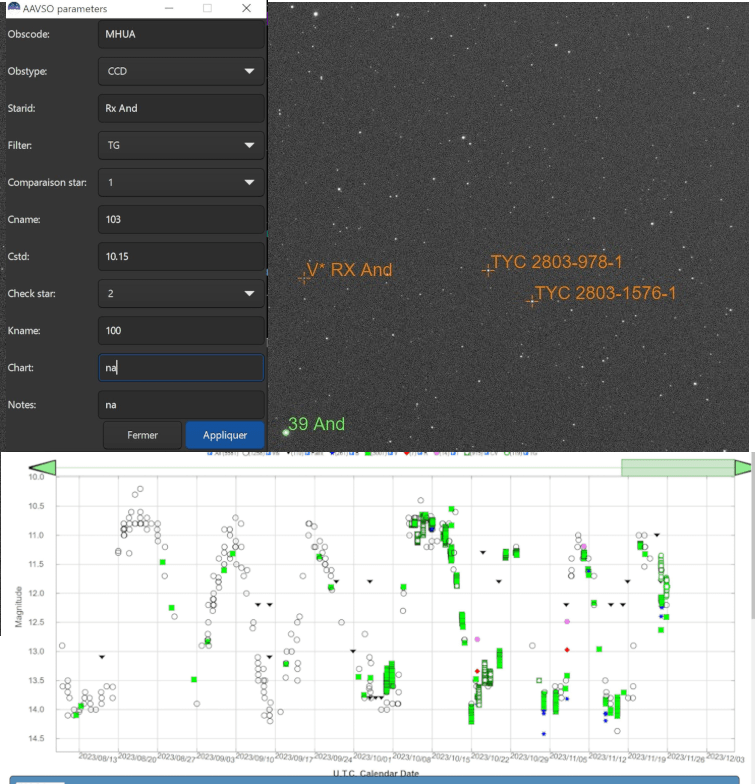
A concrete example of variable star photometry (courtesy of H. Meunier).
Automatic star selection
Automated Light Curve
In order to automate the process of exoplanet transit analysis, lists of reference stars, also called comparison stars, could be obtained from star catalogues, with the appropriate criteria: similar magnitude, similar color (to not change their relative magnitude with atmospheric extinction at different elevations), proximity.
The capture software N.I.N.A has an
exoplanet plugin that will show such stars and allow the list to be saved in a
CSV file, such as csv file:
Type,Name,HFR,xPos,yPos,AvgBright,MaxBright,Background,Ra,Dec
Target,HD 189733 b,2.6035068712769851,1992,1446,1640.3703703703704,39440,1917.0601851851852,300.18333333333328,22.709722222222222
Var,SW Vul,2.8626145609282911,2972,276,26.14,2012,1905.445,300.02171,22.93517
Var,DQ Vul,2.372369130017419,3006,1040,28.180555555555557,2048,1906.9027777777778,300.01254,22.78103
Var,HQ Vul,3.8351043206620834,157,1690,49.393939393939391,2104,1905.7454545454545,300.55808,22.64067
...
Comp1,ATO J300.3222+22.7056,2.4268101078425852,1367,1465,352,4496,1913.9504132231405,300.32229415181337,22.705681453738887
Comp1,HD 189657,2.5343988482845927,2527,2808,23.814814814814813,2012,1906.5061728395062,300.08714683055996,22.4400393728
...
Comp2,000-BJP-946,2.2738807043120195,1832,750,29.962962962962962,2024,1910.0648148148148,300.23741666666666,22.846999999999998
Comp2,000-BJP-942,2.0977710589704297,2760,1572,31.083333333333332,2096,1908.6527777777778,300.025875,22.704777777777778
...
Using , Siril can load this file. To use this, a few prerequisites must be met:
the calibrated images sequence must be already loaded
the reference image of the sequence must be plate solved, to make sure we identify the correct stars from their equatorial J2000 coordinates
From there, everything is automatic, showing the light curve for the selected comparison stars at the end of the process.
In this window, the used aperture and background areas are also reminded.
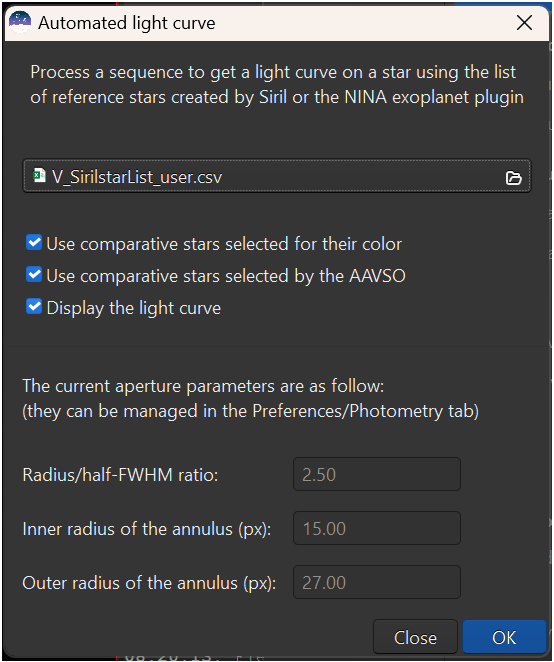
The Automatic Photometry window.
The following video shows an automated processing of light curve with comparison star list from NINA:
Light curve through Command
It is also possible to automate or create the light curve remotely using the
light_curve command. As blind operation needs as much automation as
possible, the configuration of the background annulus radii can be automated
with the -autoring argument: it runs a star detection in the reference
image and multiplies the mean FWHM with a configurable factor to obtain the
inner and outer radii that should work with the sequence.
Siril command line
light_curve sequencename channel [-autoring] { -at=x,y | -wcs=ra,dec } { -refat=x,y | -refwcs=ra,dec } ...
light_curve sequencename channel [-autoring] -ninastars=file
Generating a list of comparison stars
If you are not a NINA user, or you wish to build your own file and then use the Automated light curve feature , since Siril-1.3 you can generate a list of comparison stars using the new Siril tool.
List through GUI
This feature can be accessed via , once the current displayed image of the loaded sequence has been plate solved.
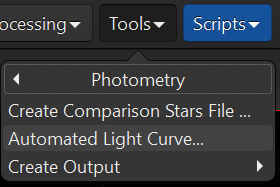
The Create Comparison Stars File... feature in the Tools menu.
A prerequisite is to load a representative, plate solved, image of the sequence.
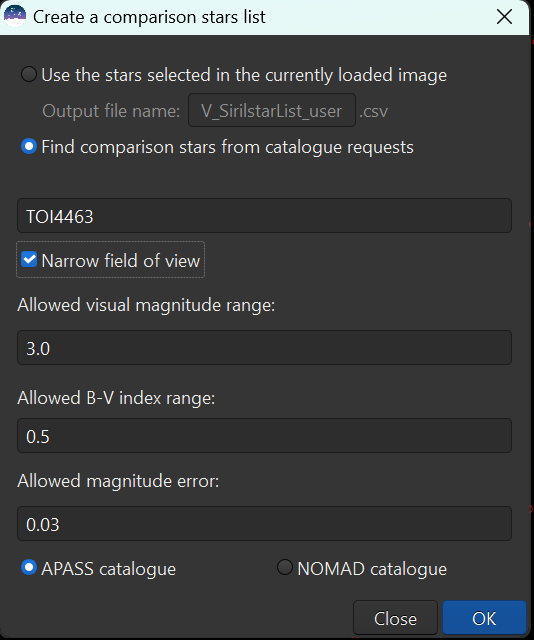
Basic GUI for the Comparison Stars window.
The Find comparison stars from catalogue request is mandatory in the use case.
The first field must be the variable star name you plan to get the light curve of.
The check button Narrow field of view enables to select a circle centered on the image.
The second field is de delta_Vmag value. This is the maximum discrepancy from the target V magnitude (0.0 < delta_Vmag < 6.0). Default value is set to 3.0.
The third field is the delta_BV value. This is the maximum discrepancy from the target BV index (0.0 < delta_BV < 0.7). Default value is set to 0.5.
The fourth field is the max_emag value. This is the maximum allowed statistical error on Vmag (0.0 < max_emag < 0.1). Default value is set to 0.03.
Then, you can choose the source of the comparison stars: from the APASS catalogue or NOMAD catalogue.
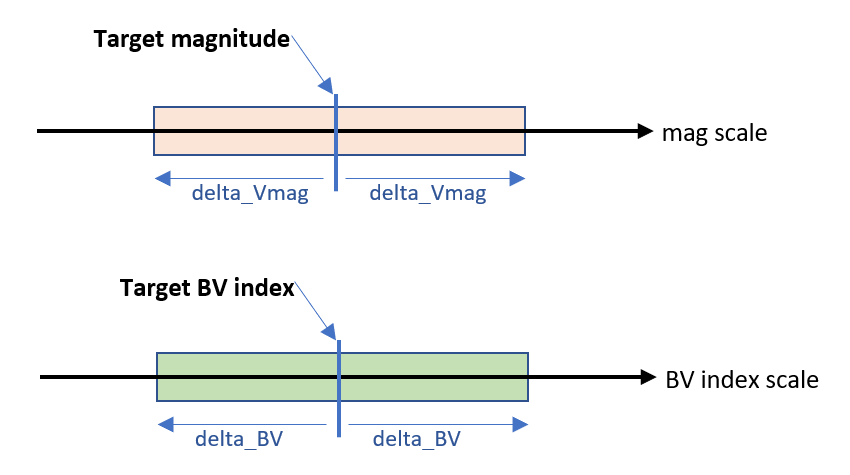
These two criteria help you to get comparison stars matching the target magnitude and color index.
The maximum number of comparison stars is internally set to 20.
After you click OK, a request is sent to the adequate server.
The answer is a list of stars, coming from the chosen catalogue, matching your criteria, displayed in red in your image and saved as a CSV file compatible with the NINA Exoplanet process.
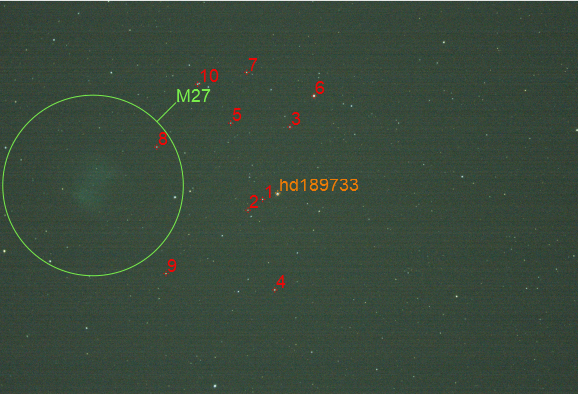
Note: As the stars are red labelled, they belong to a temporary catalogue that shall be emptied after the Annotation button is toggled.
Tip
Additional information on choosing the comparison stars can be found in the DSLR Observing Manual - Version 1.4 page 67 from AAVSO.
List through command
A command also exists to perform the "find comparison stars" process. It allows you to refine your choice further more.
Siril command line
findcompstars star_name [-narrow|-wide] [-catalog={nomad|apass}] [-dvmag=3] [-dbv=0.5] [-emag=0.03] [-out=nina_file.csv]
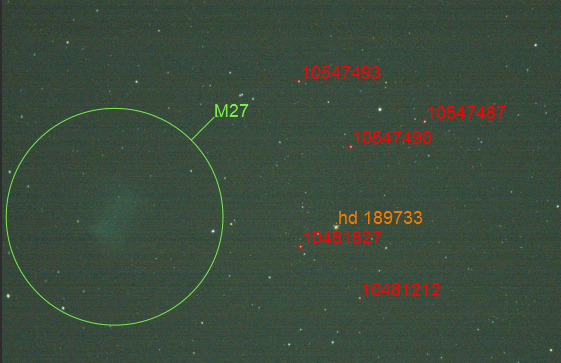
-narrowlimits the field of search to a circle inscribed and centred in your image. This avoids choosing stars in a potentially distorted part of the image.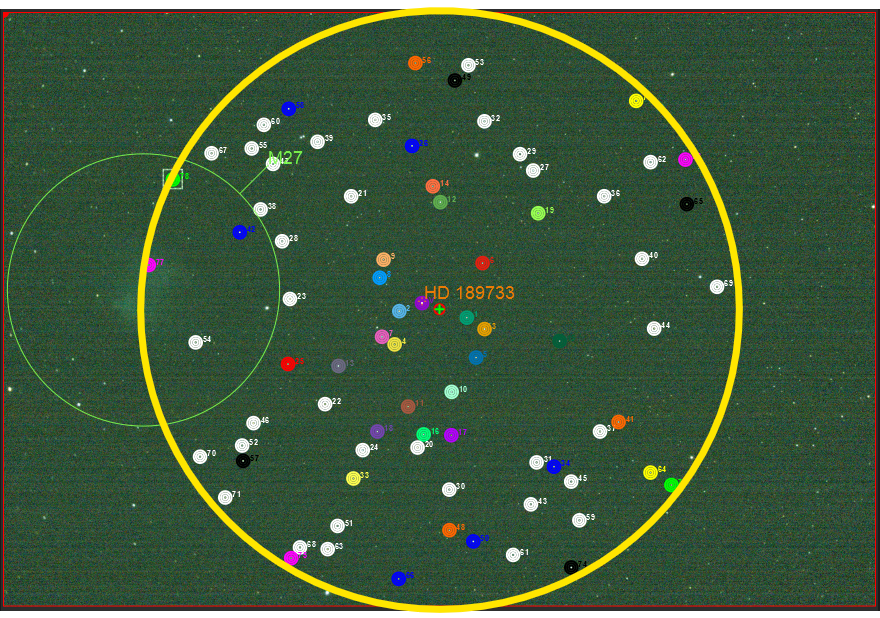
View of the
-narrowlimited field of search. (the yellow circle is for illustration purposes only)Without the
-narrowoption, comparison stars are searched across the entire picture. It can be useful in case of a poorly populated field of view.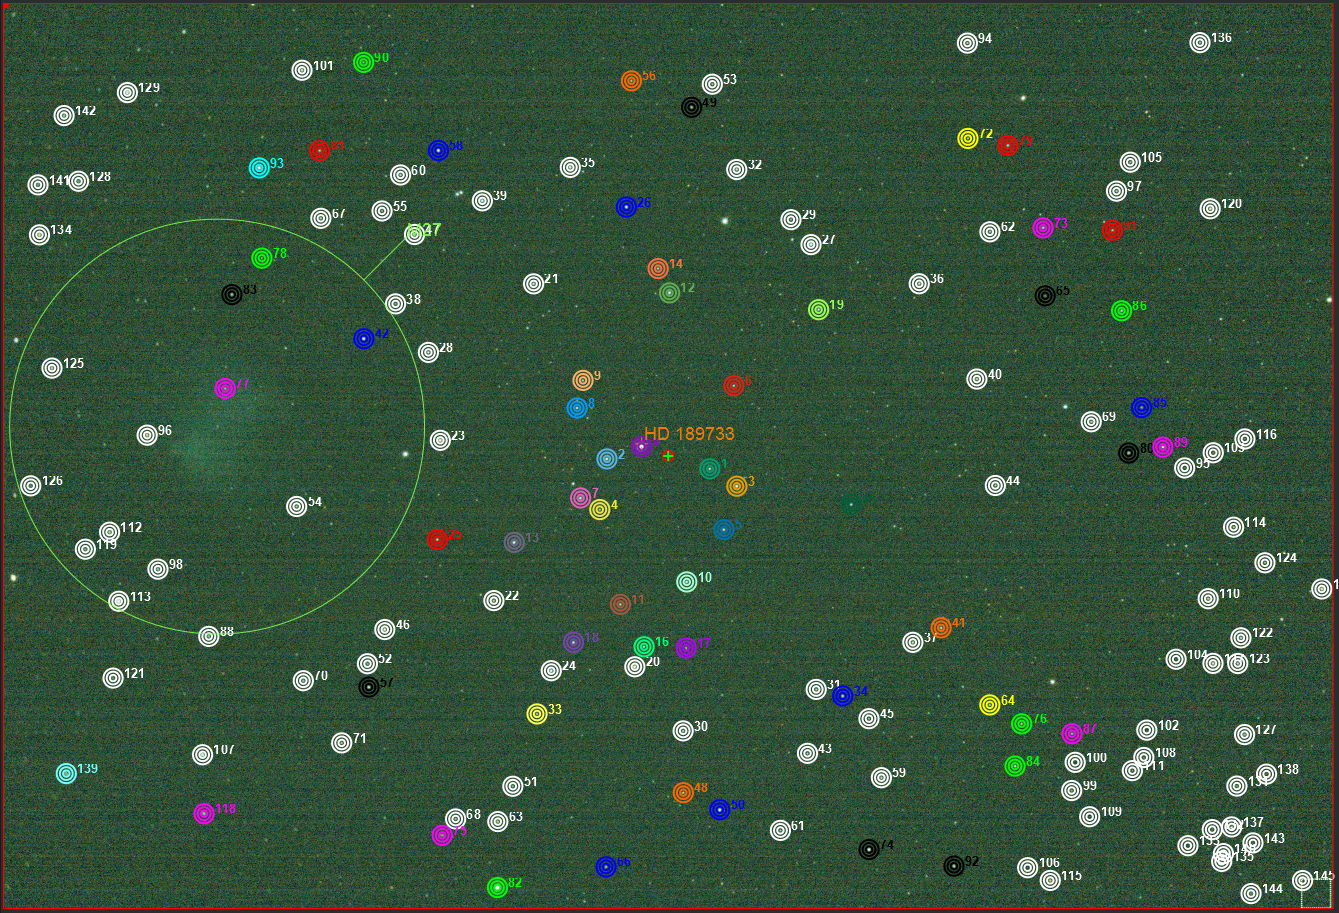
View of the wider field of search.
[-catalog={nomad|apass}]allows you to choose between the NOMAD catalogue and the APASS catalogue (by default).
Tip
The displayed names will be reduced to simple numbers, sorted by increasing distance wrt. image center These labels are only for information.
[-dvmag=3],[-dbv=0.5]and[-max_emag=0.03]stand respectively for delta_Vmag, delta_BV and max_emag criteria as explained previously.[-out=nina_file.csv]sets the name of the CSV file.
Tip
APASS stands for AAVSO Photometric All Sky Survey. Additional information can be found here.
The AAVSO Photometric All-Sky Survey (APASS DR9) provides calibrated magnitudes in the range 7.0 < Vmag < 17.0 for the entire sky, in the BVugriZsY bandpasses.
The photometry is accurate to about 0.02 mag, and the astrometry is accurate to about 0.15 arcsec (see Using APASS and 2GSS for studying variable stars).
Discarding potential variable stars
Among the returned stars from either APASS or NOMAD, a few of them can be identified as variable stars. If one (or more) of these stars are selected as comparison stars, their flux variation can affect the final result for the variable star under study.
So the automatic comparison star list feature of Siril is able to find these outlier stars and discard them accordingly.
Three main catalogues can be used to detect variable stars:
The General Catalogue of Variable Stars (GCVS). Provides more than 89000 variable stars.
The AAVSO VSX, it lists all stars that have an entry in the AAVSO International Variable Star Index.
The GAIA varisum GAIA varisum, a sub table of GAIA DR3 listing "potential variable objects".
These 3 catalogues can be used one by one or all at the same time during the discarding process. But you have to be aware that each selected catalogue results in an additional online request.
Basically, only the GAIA Varisum is selected. However, the user can still make his own choice.
The used catalogues are managed with a Siril variable,
photometry.discard_var_catalogues according to the following table:
Variable value |
Binary |
GCVS |
AAVSO VSX |
GAIA Varisum |
|---|---|---|---|---|
0 |
0000 |
|||
1 |
0001 |
✔ |
||
2 |
0010 |
✔ |
||
3 |
0011 |
✔ |
✔ |
|
4 |
0100 |
✔ |
||
5 |
0101 |
✔ |
✔ |
|
6 |
0110 |
✔ |
✔ |
|
7 |
0111 |
✔ |
✔ |
✔ |
(It can be seen in the previous table that the variable can be written in binary
format, with bit#0 as GCVS, bit#1 as VSX and bit#2 as GAIA-Varisum).
One can read this variable with the command:
get photometry.discard_var_catalogues
One can assign another value to the variable with the command:
set photometry.discard_var_catalogues=4
As an example, with the command:
set photometry.discard_var_catalogues=7
You will have the 3 catalogues checked and the console will display:
Contacting server
-> 5 variable stars found within the image from AAVSO Variable stars
Contacting server
-> 1 variable stars found within the image from GCVS
Contacting server
-> 8 variable stars found within the image from Gaia DR3 Variability
Output file structure
While using the findcompstars command and setting -out=auto or the GUI
Comparison stars button, one will get a file name with the following
structure:
[star_name]_SirilstarList_[delta_Vmag]_[delta_BV]_[max_emag]_[catalogue].csv
Additional information is also supplied (as comments) in the file header:
# Sorted comparison stars for KELT-16 from APASS according to the following criteria
# Siril: 12 stars, dVmag 1.00, dBV 0.30, max e_mag 0.03
type,name,ra,dec,mag
Target,KELT-16,314.268494,31.661009,11.72
Comp1,1,314.256578,31.660406,12.307
Comp1,2,314.317434,31.754368,12.431
Comp1,3,314.305316,31.546814,11.682
Comp1,4,314.263680,31.541927,12.084
Comp1,5,314.465451,31.626255,12.084
Comp1,6,314.459388,31.596876,11.979
Comp1,7,314.452316,31.746360,11.504
Comp1,8,314.437181,31.827260,11.24
Comp1,9,314.314246,31.879192,12.313
Comp1,10,314.431752,31.839763,10.88
Comp1,11,314.006569,31.666214,11.896
Comp1,12,314.304606,31.925116,11.713