Statistics
This is a documentation for Siril's statistics, given by the graphical user interface (GUI) from the menu ) then selecting Statistics..., or using the stat command. Note that when using the GUI, it is possible to draw a selection in the loaded image and that when doing so, the statistics are computed on the pixels of region.
The option Per CFA channel allows you to calculate statistics for each R, G and B channel in CFA images, even if the image has not been demosaiced.
Tip
When a CFA image is loaded, the selection will be constrained to a minimum size of 2x2 for Bayer images and 3x3 for X-Trans images so that there is at least one pixel in each Bayer channel within the selection, to ensure that it is possible to generate statistics.
Many of these values are measures of statistical dispersion.
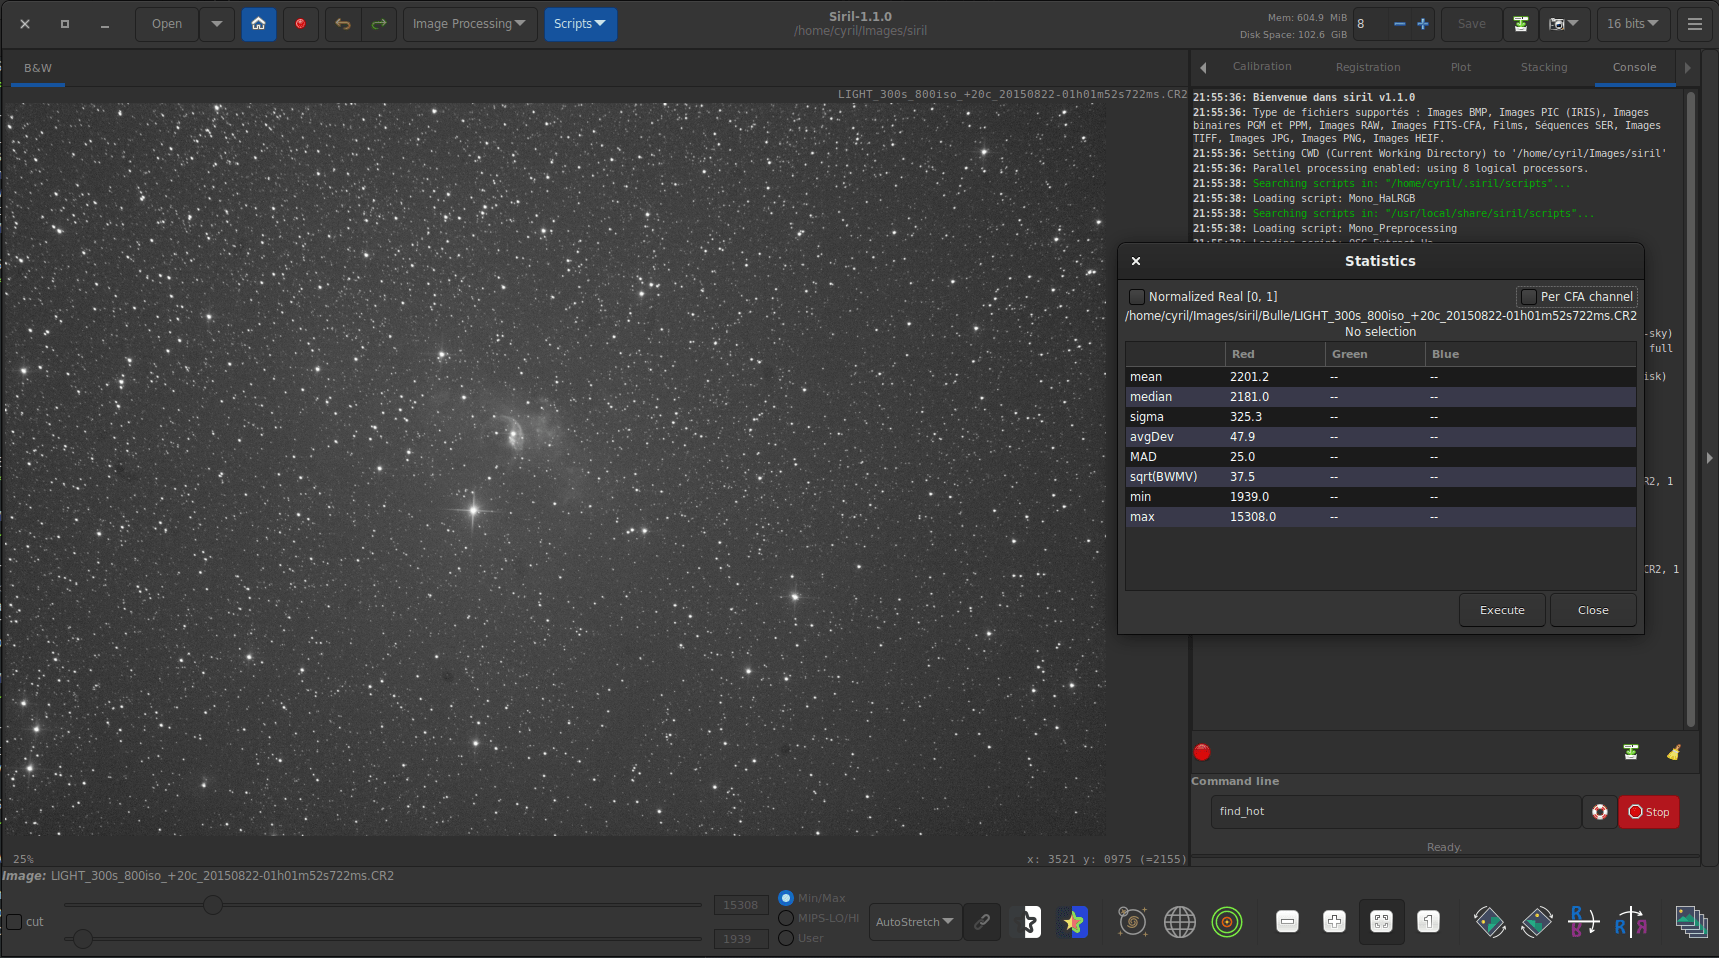
One channel statistics for CFA image. The given values are not really relevant in this case.
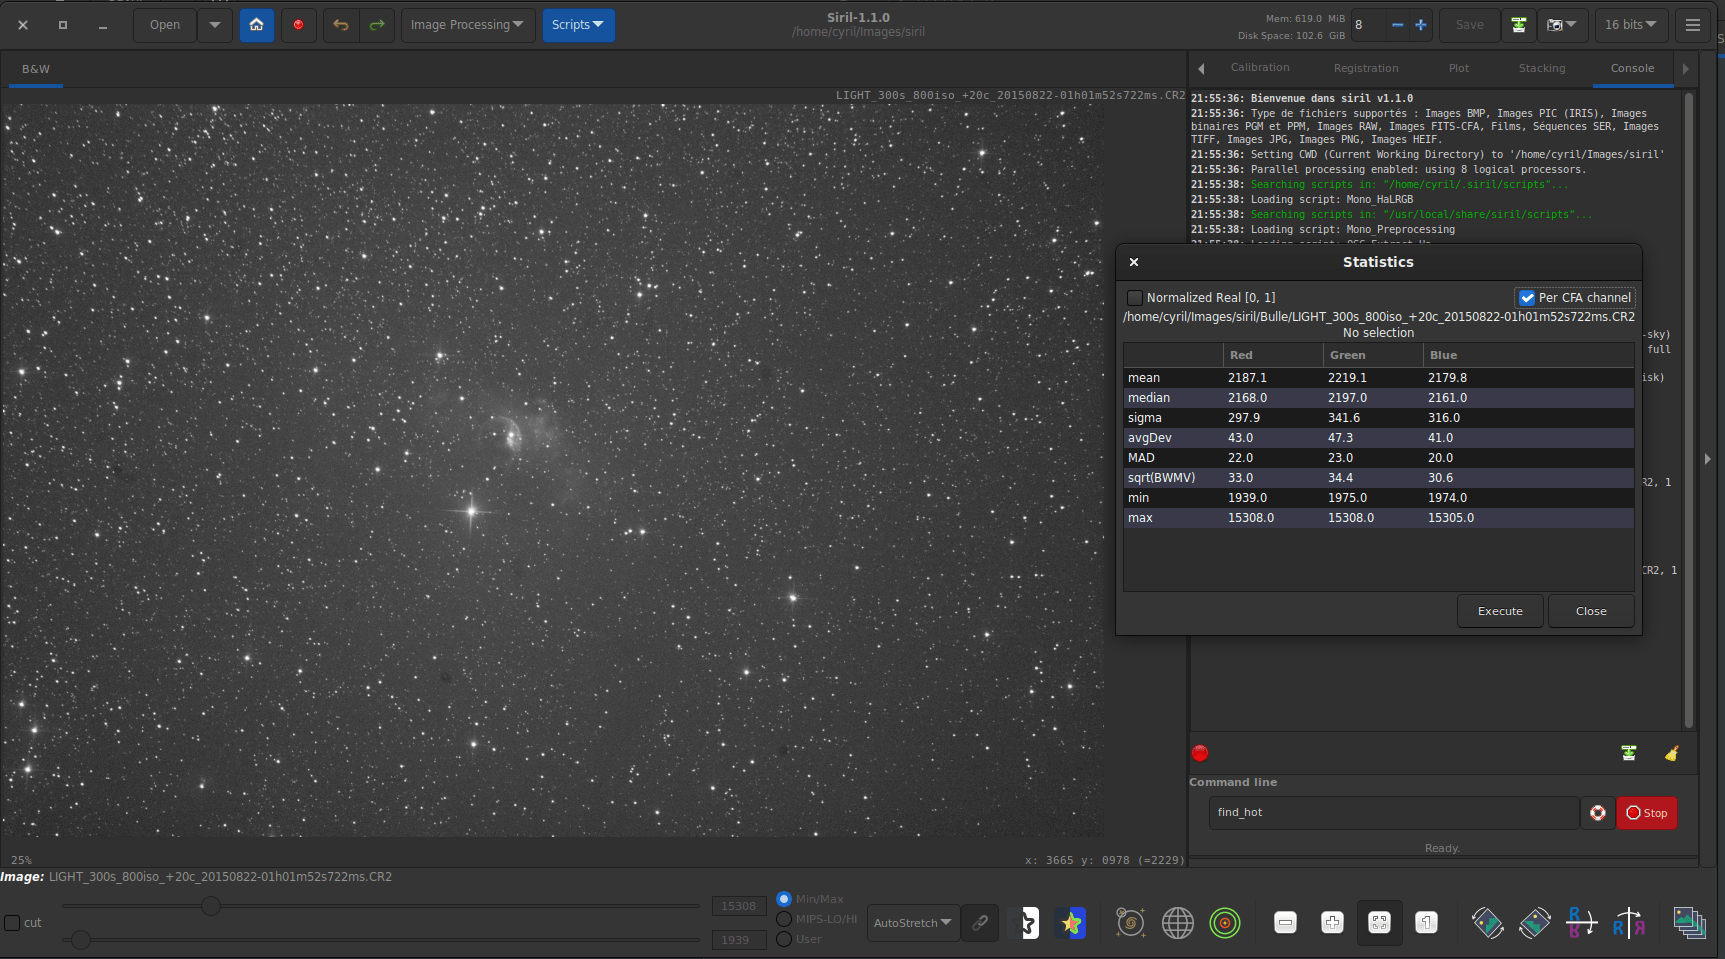
Three channel statistics for CFA image.
Siril command line
stat [-cfa] [main]
Estimators
Mean
This is the arithmetic mean, also known as average or arithmetic average. This is computed by doing the sum of the pixel values divided by the number of pixels in an image channel.
Median
The median is the value separating the higher half from the lower half of a dataset. Generally, it represents the value of the background of an astronomical image.
Sigma
Also known as the standard deviation, noted \(\sigma\), this is a measure of dispersion of the image pixels based on squared differences from the average. The sigma value of a sub image containing only the background will represent the noise of the image.
Background noise
This estimator is available by the GUI from the menu , and is also displayed at the end of stacking.
This is a measure of estimated noise in image background level, for pixels having a value low enough to be considered as background. It is an iterative process based on k.sigma (a factor of the standard deviation above the median), so there is no fixed threshold for the low enough.
Siril command line
bgnoise
avgDev
The Average Deviation, also called AAD for average absolute deviation or mean absolute deviation. In order to understand what the average deviation is, one needs to understand what the term absolute deviation is. Absolute deviation is the distance between each value in the dataset and that dataset's mean (in this instance) or median (for MAD below). Taking all of these absolute deviations, finding the average, and the mean average deviation is computed. To simplify, if standard deviation is the squared deviation from the mean, this is the linear version of it.
MAD
The Median Absolute Deviation is a robust measure of how spread out a set of data is. The absolute deviation and standard deviation are also measures of dispersion, but they are more affected by extremely high or extremely low values. It is similar to the average deviation above, but relative to the median instead of the mean.
BWMV
The biweight midvariance is yet another tool to measure dispersion of a dataset, even more robust than others cited above to outliers. It discards the data points too far way from the median and computes a weighted variance, weights decreasing as the data points are further way from the median. The estimator of dispersion is the square root (marked as \(\sqrt{BWMV}\)) of this value.
Location and Scale
These parameters, often colloquially called scale and offset, are not displayed in the user interfaces but are computed internally by Siril. In order to align the histograms of the different images for normalization before stacking, one needs to compute where they are in terms of level and how wide they are in terms of spread. A valid estimator of location could be taken as the median while the MAD or the \(\sqrt{BWMV}\) could be used for scale. However, in order to give more robustness to the measures, the pixels more than \(6\times \text{MAD}\) away from the median are discarded. On this clipped dataset, the median and \(\sqrt{BWMV}\) are re-computed and used as location and scale estimators respectively. They are computed relative to the reference image of a sequence in Siril.