Plotting Feature
Siril has a tab for displaying graphs of the data calculated during alignment or other calculations. This tab is very powerful and allows for easy sorting of the images as well as in-depth analysis of them. The shortcut to access this tab is F5.
Registration Plot
In order to improve manual sorting of your registered frames, plotting capabilities have been added in the Plot tab. After completing Registration of your sequence (or when loading a registered sequence), a dropdown list now enables to select parameters of interest for both plotting and sorting your data.
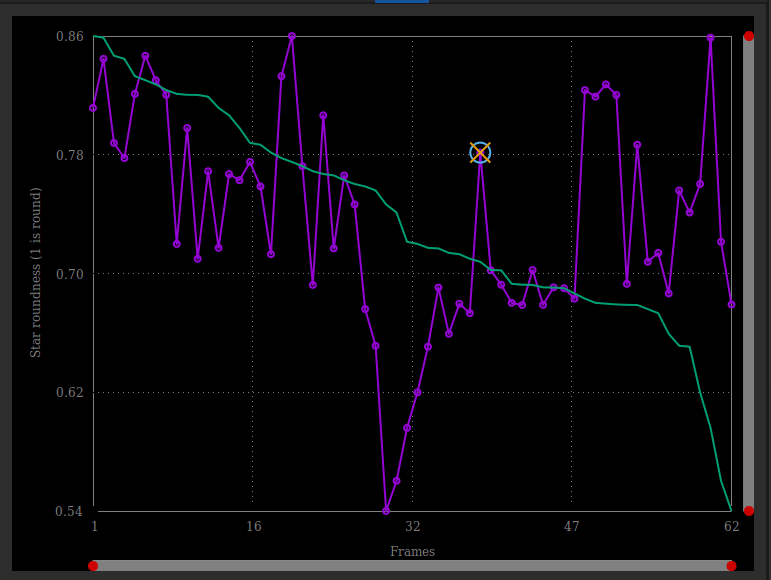
Plot tab as shown after a global registration.
You can also choose to plot one of the parameter vs another. Items available in the dropdown list are:
FWHM: This is the maximum width at half maximum, one of the most common criteria to judge the quality of a deep sky image.
Roundness: The roundness r is computed as the ratio of \(\frac{\text{FWHMy}}{\text{FWHMx}}\).
wFWHM: This is an improvement of a simple FWHM. The FWHM is weighted by the number of stars in the image. For the same FWHM measurement, an image with more stars will have a better wFWHM than an image with fewer stars. It allows to exclude much more spurious images by using the number of stars detected compared to the reference image.
Background: Average sky background value.
# Stars: This is the number of stars used for registration.
X Position: X-shift with regards to the reference.
Y Position: Y-shift with regards to the reference.
Quality: This criterion is a number in the range [0, 1] that defines the quality of images that have been processed by any planetary registration algorithm.
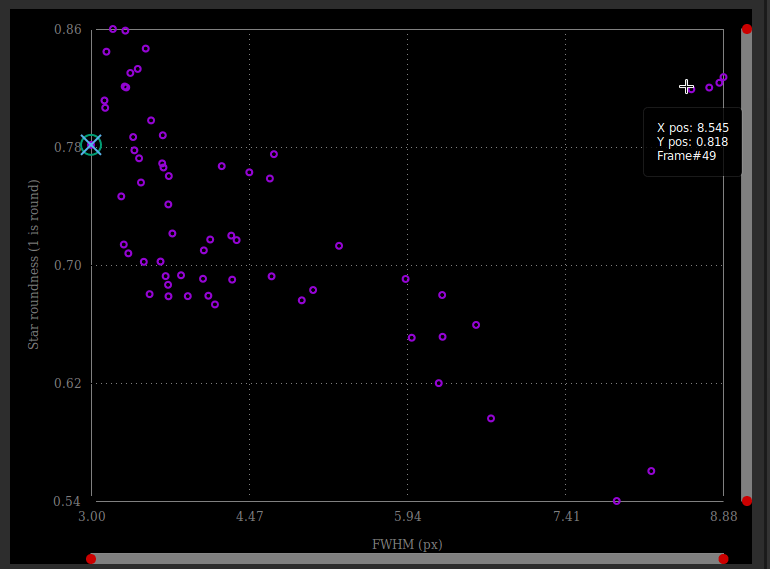
The values of roundness vs FWHM are displayed as a scatter plot. Hover onto the different data points to show X and Y values, together with the corresponding frame number.
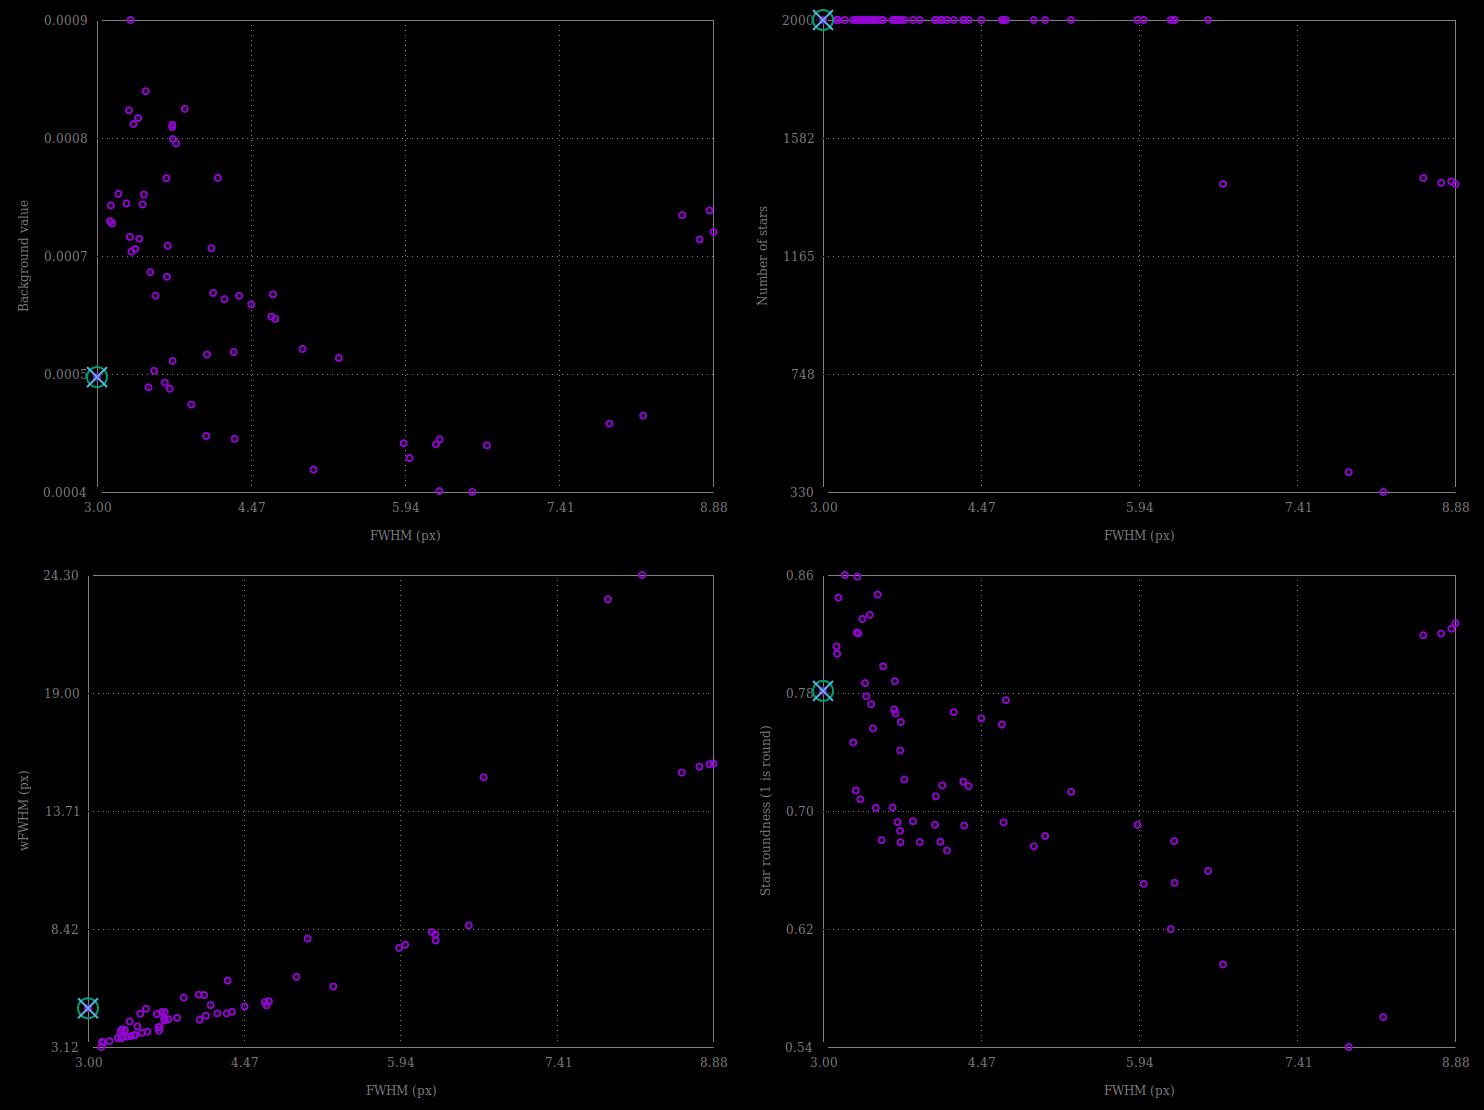
Different possibility of graphics taken with the same set of images.
Click on one of the data point to exclude the frame or to open it. The later option will load the picture and pop out the frame selector. The parameter chosen for Y values is reflected in the frame selector last column, which can then be used to sort, review and select or unselect subs from the sequence.
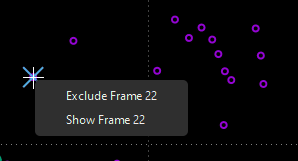
Right-click on a data point to exclude or to load it in the Image preview
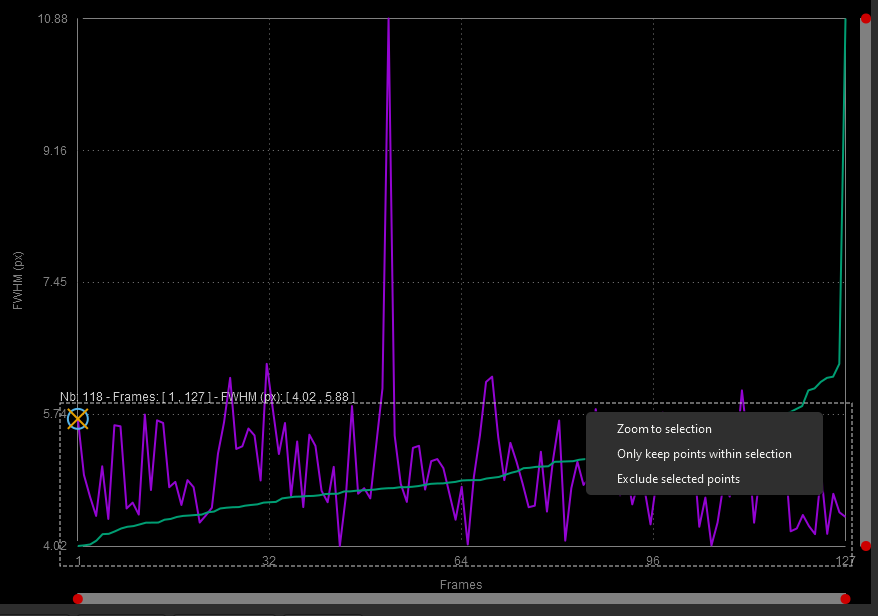
You can also mass select/unselect multiple data points by drawing a selection onto the plot. The information at the top of the selection tells the number of points selected, as well as the boundary values of your selection. You can reshape the selection just as you would do with a drawn selection in the Image view. Once happy with your selection, a right-click will display a menu to keep or exclude the points, or to set the zoom to the selection.
Right-click on a drawn selection to mass select/unselect or to zoom
Photometry Plot
To complement sorting and filtering frames from the sequence, you can also perform a PSF on a star for the full sequence. The procedure is detailed in the photometry page. Then the photometry item in the first dropdown list becomes sensitive and is automatically selected. The other dropdown list contain the following items:
FWHM: Maximum width at half maximum, as defined above.
Roundness: The roundness r is computed as the ratio of \(\frac{\text{FWHMy}}{\text{FWHMx}}\).
Amplitude: It is the maximum value of the fitted function, located at the centroid coordinates.
Magnitude: Relative magnitude of the analyzed star.
Background: Average of the local sky background value taken in the annulus.
X Position: X-shift with regards to the reference.
Y Position: Y-shift with regards to the reference.
SNR: An estimator of the signal-to-noise ratio.
In photometry, unlike registration, it is not possible to change the X axis. And only the number of images can be used (or the Julian day).
The Clear plots button combines the Clear all and Clear latest menus to clear either all photometric curves, or the last one drawn.
Plot interactions
Here is a summary of the possible interactions with the plot window:
Left-click in a slider : puts the nearest red dot on it
Double-click in a slider : resets this axis
Right-click + drag in a slider : move the zoom on this axis
Left-click + drag in the plot area : draws a selection
Left-click + drag on a selection edge : resize the selection
Double-click in the plot area : reset the zoom on the 2 axes
Right-click when a selection is active : display the menu to : zoom on the selection/ keep only the points of the selection/ exclude the points of the selection
Left-click when a selection is active : delete the selection