強度プロファイル

Sirilには強度プロファイルモードがあります。ユーザーが2点間の線を選択すると、Sirilはその間のピクセル値のグラフを生成します。これにはいくつかの使い道があります。個々の星や銀河全体の強度プロファイルを調べるのに使えます。
基本強度プロファイル
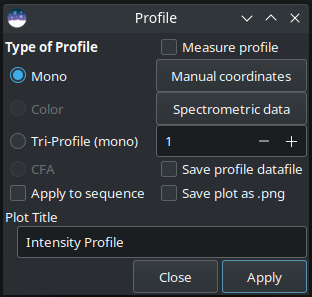
星や他の天体の基本強度プロファイルを作るには、下のツールバーのプロファイルボタンを選択します。これでSirilはプロファイルモードになり、小さなダイアログが開きます。
これで、メイン画像ディスプレイ上でクリック&ドラッグして、プロファイルしたい線の始点と終点を設定できます。Shift キーを押しながら線をドラッグすると、水平または垂直にスナップします。
Tip
プロファイルの線が正確に水平または垂直である場合、正確なピクセル値を画像から直接使用できます。プロファイルの線が水平でも垂直でもない場合、プロットされる点はピクセル上に正確に配置されないので、バイリニア補間されたピクセル値が使用されます。
グラフのカスタムタイトルは、ダイアログ下部のコントロールで入力できます。
Tip
シーケンスを処理する際、タイトルの最後に()を追加することで、カスタムタイトルに画像番号と総数を表示させることができます。例えば、Solar Spectra () と入力すると、Solar Spectra (1 / 5), Solar Spectra (2 / 5) などのタイトルが生成されます。単一の画像を処理する場合、括弧は無視され削除されます。
プロファイルの種類
ラジオボタンで希望のプロファイルを選んでください。(下の画像例をクリックすると原寸大で表示されます。)
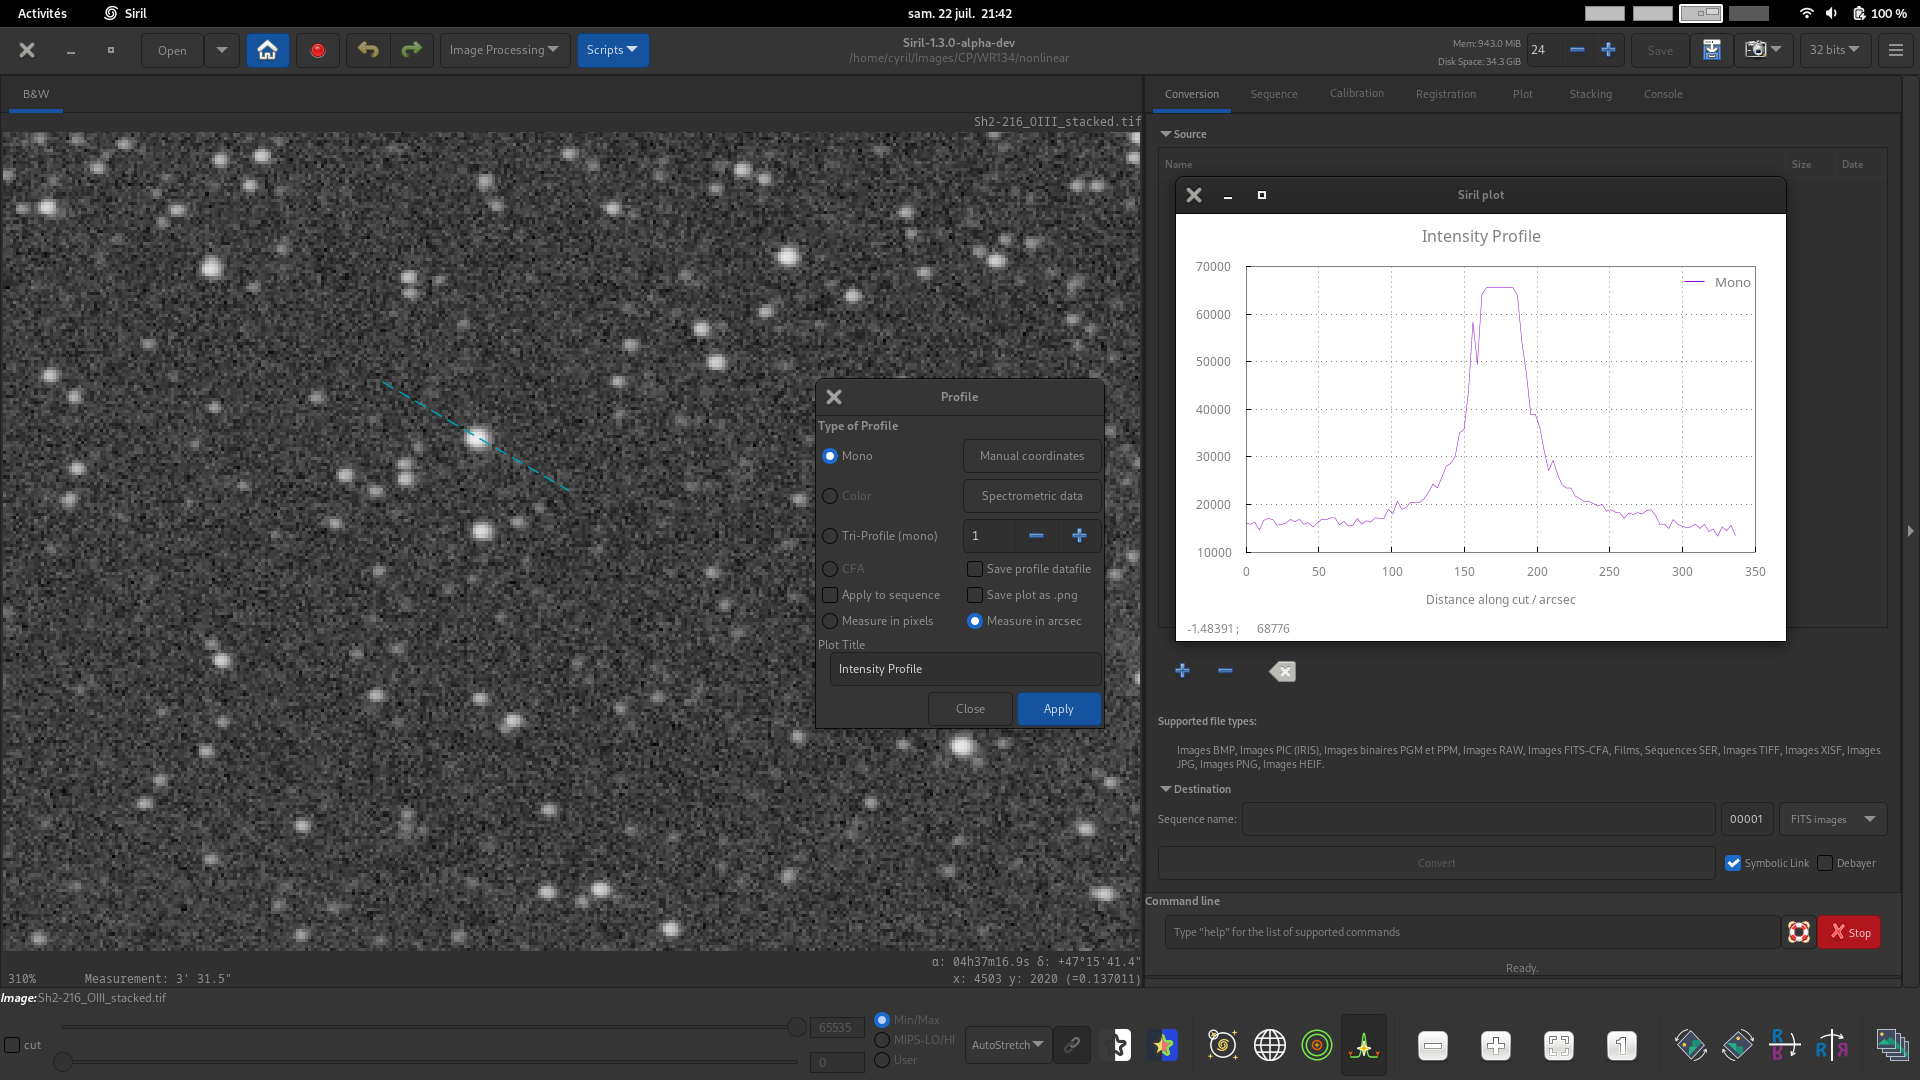
白黒プロファイル。白黒またはカラー画像に対して、2点間の輝度プロファイルを生成します。このモードは分光データで使用できます。
Tip
カラー画像が読み込まれ、白黒プロファイルモードが選択されている場合、プロファイルはビューポートに従って作成されます。R、G、Bビューポートは、それぞれのチャンネルの白黒プロファイルを提供し、RGBビューポートは、3つのチャンネルすべてに等しく重み付けされた輝度プロファイルを提供します。
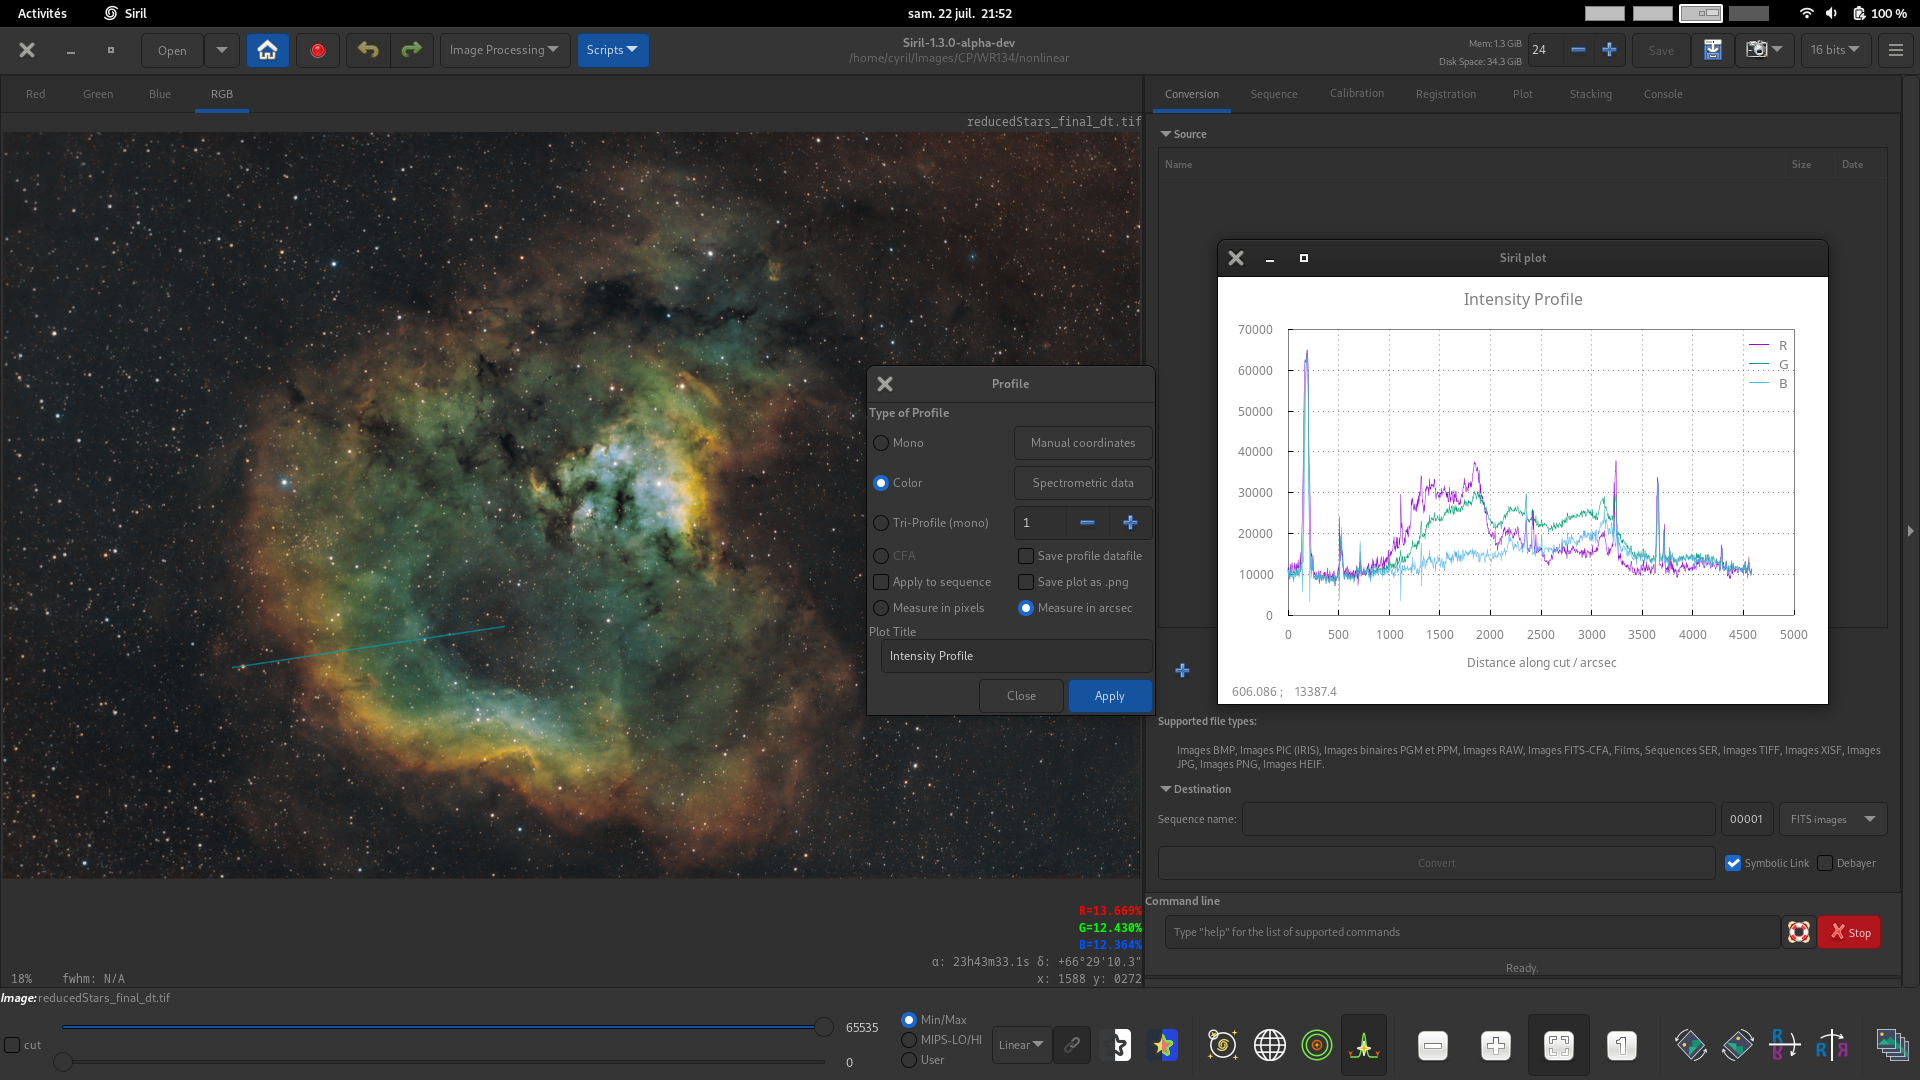
カラープロファイル。カラー画像の場合、2点間のR、G、Bピクセル値の3つのプロファイルを生成します。このモードは分光データで使用できます。
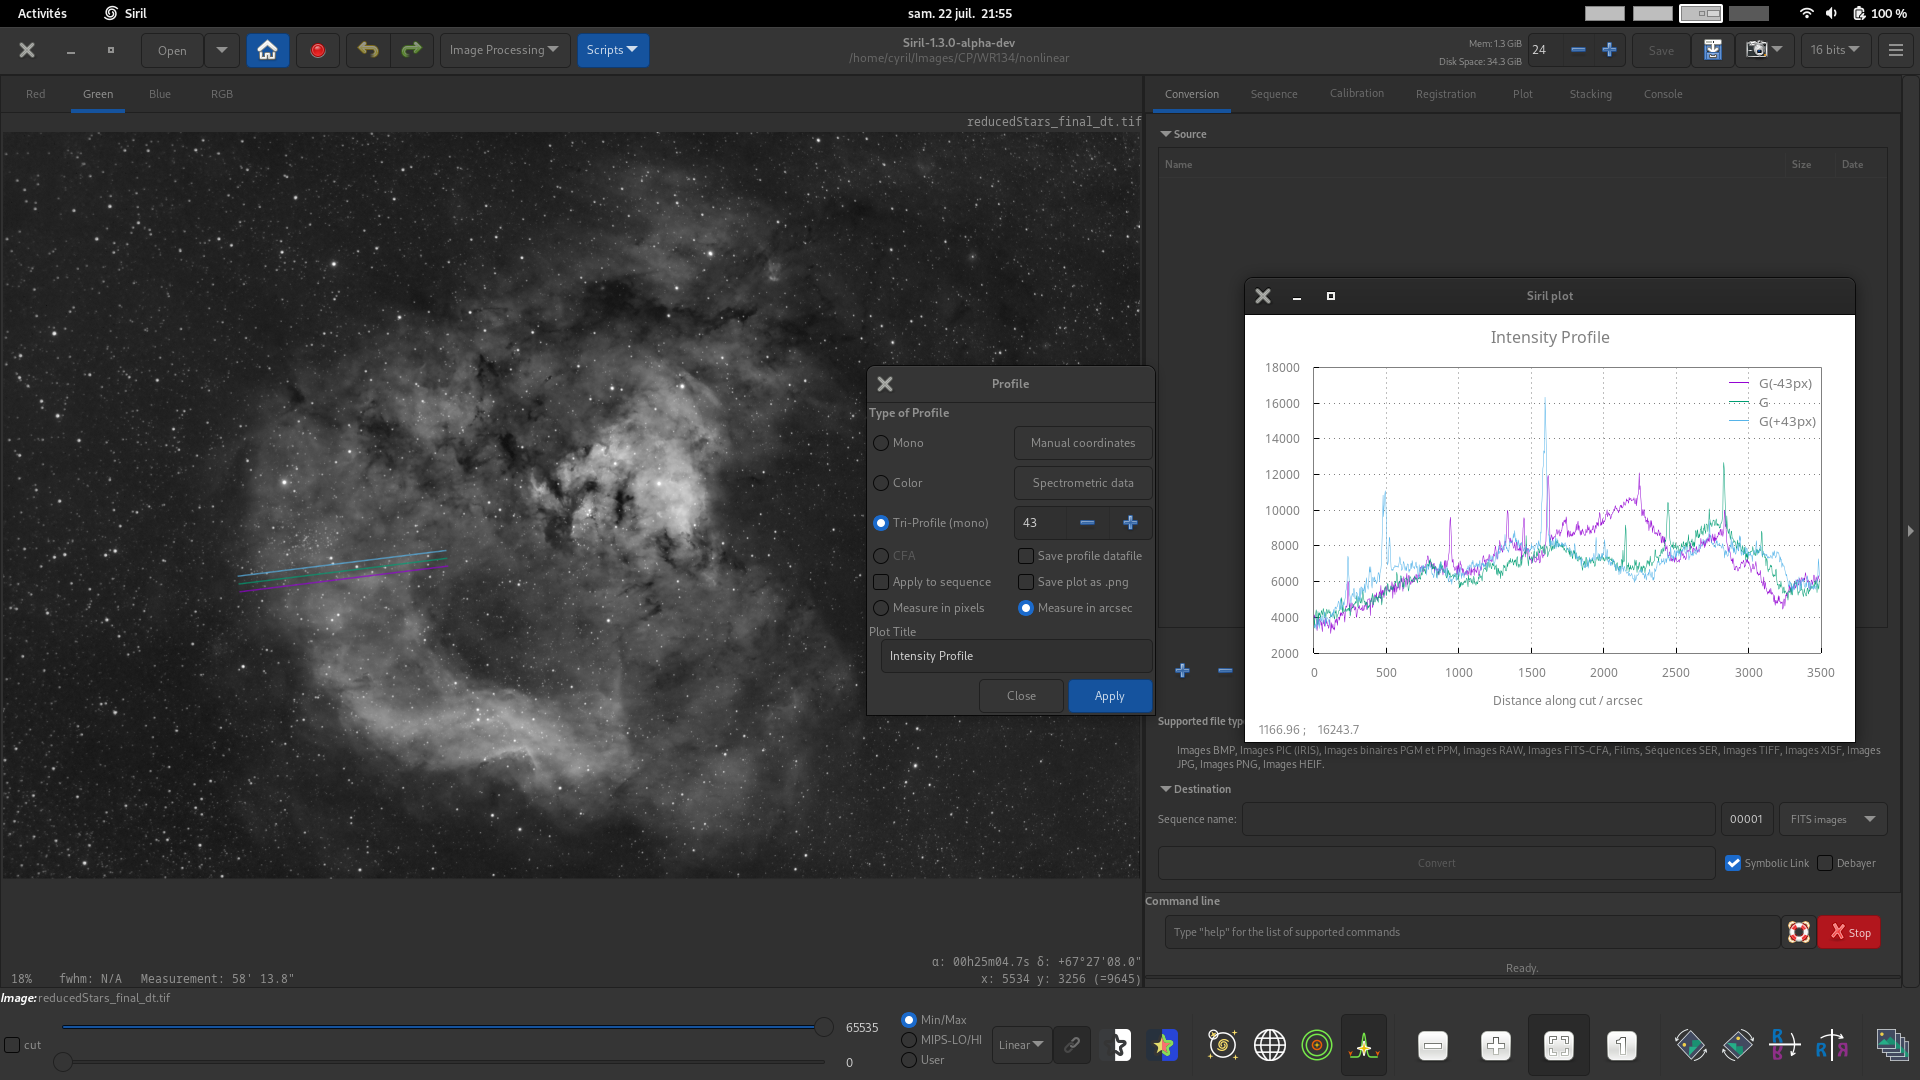
トライプロファイル(白黒)*。白黒またはカラー画像の場合、2点間の平行な3つの等間隔輝度プロファイルを生成します。3つのプロファイルの間隔はスピンボタンで設定できます。
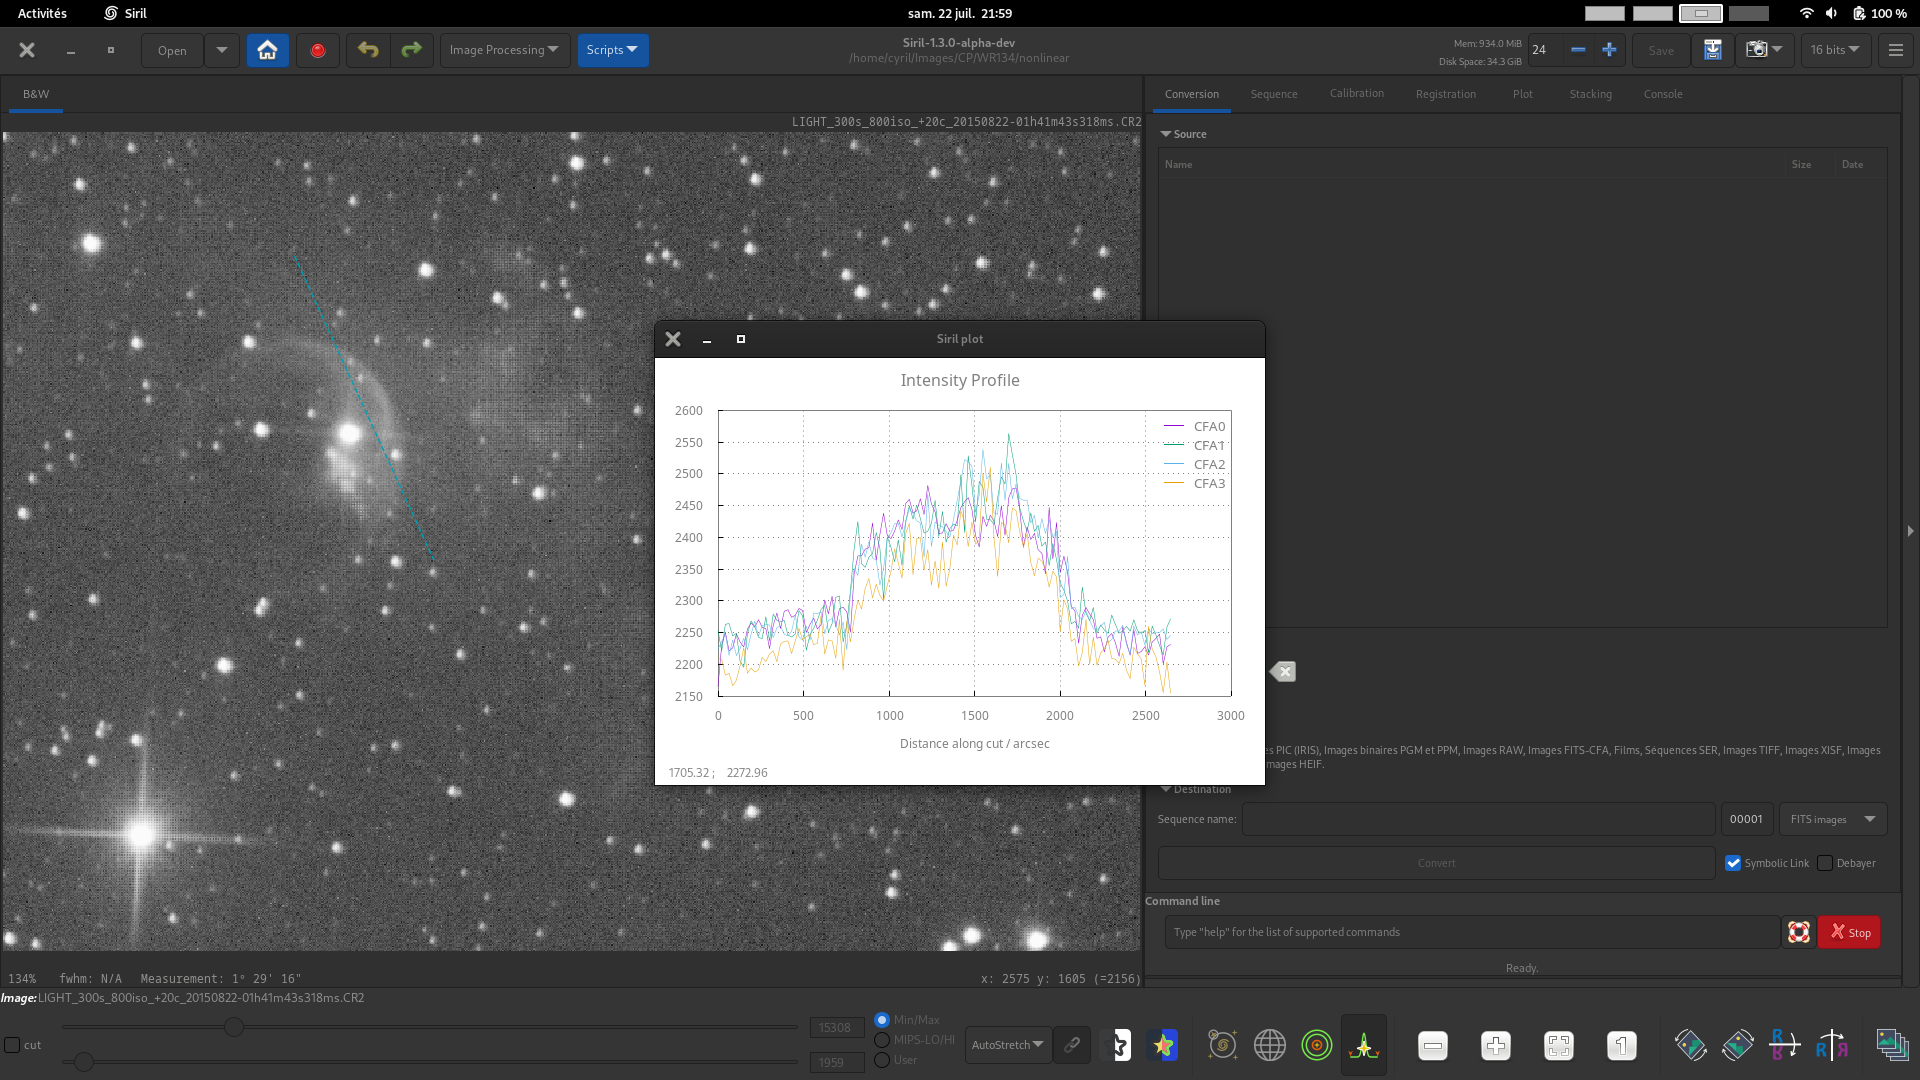
CFA. For images with a Bayer pattern only, generate four profiles for the four CFA subchannels between two points. This can be particuarly useful for inspecting the profile of Bayer patterned flats or other Bayer pattern images before they are debayered.
This image demonstrates use of the Custom Title control to set a custom title for the plot.
適用 をクリックしてプロファイルを作成してください。
Precise Coordinate Entry
In order to make it easy to input coordinates precisely and repeatably, a manual entry method is provided. Click the Manual Coordinates button and you can enter the X and Y coordinates of the start and end points of the profile line. If a profile line is already drawn but one point is not quite in the place you want it, you can use this popup dialog to fine tune the placement of the endpoints.
If you wish to set an endpoint exactly to the position of a star, make a rectangular selection around the star and click the relevant star button to the right of the dialog.
注釈
When using the CFA mode, coordinates are given in the input image. However each CFA channel is half the width and half the height. The x axis in the CFA mode plot is measured in pixels in the CFA subchannel, i.e. it will span half the number of pixels that it does in the input image.
Measurement
The intensity profile line can be used as a measuring tool in two ways:
Checking the Measure profile checkbox will measure all profile lines dragged with the mouse, similarly to the Ctrl + Shift + Drag quick measurement function.
In the Coordinates dialog there is a Measure button. This provides the same measurement function but allows you to set the endpoints exactly, and then measure the profile line on demand. By selecting stars, minor planets or comet nuclei as end points as described above, measurements between two celestial bodies can be made very precisely (with sub-pixel precision).
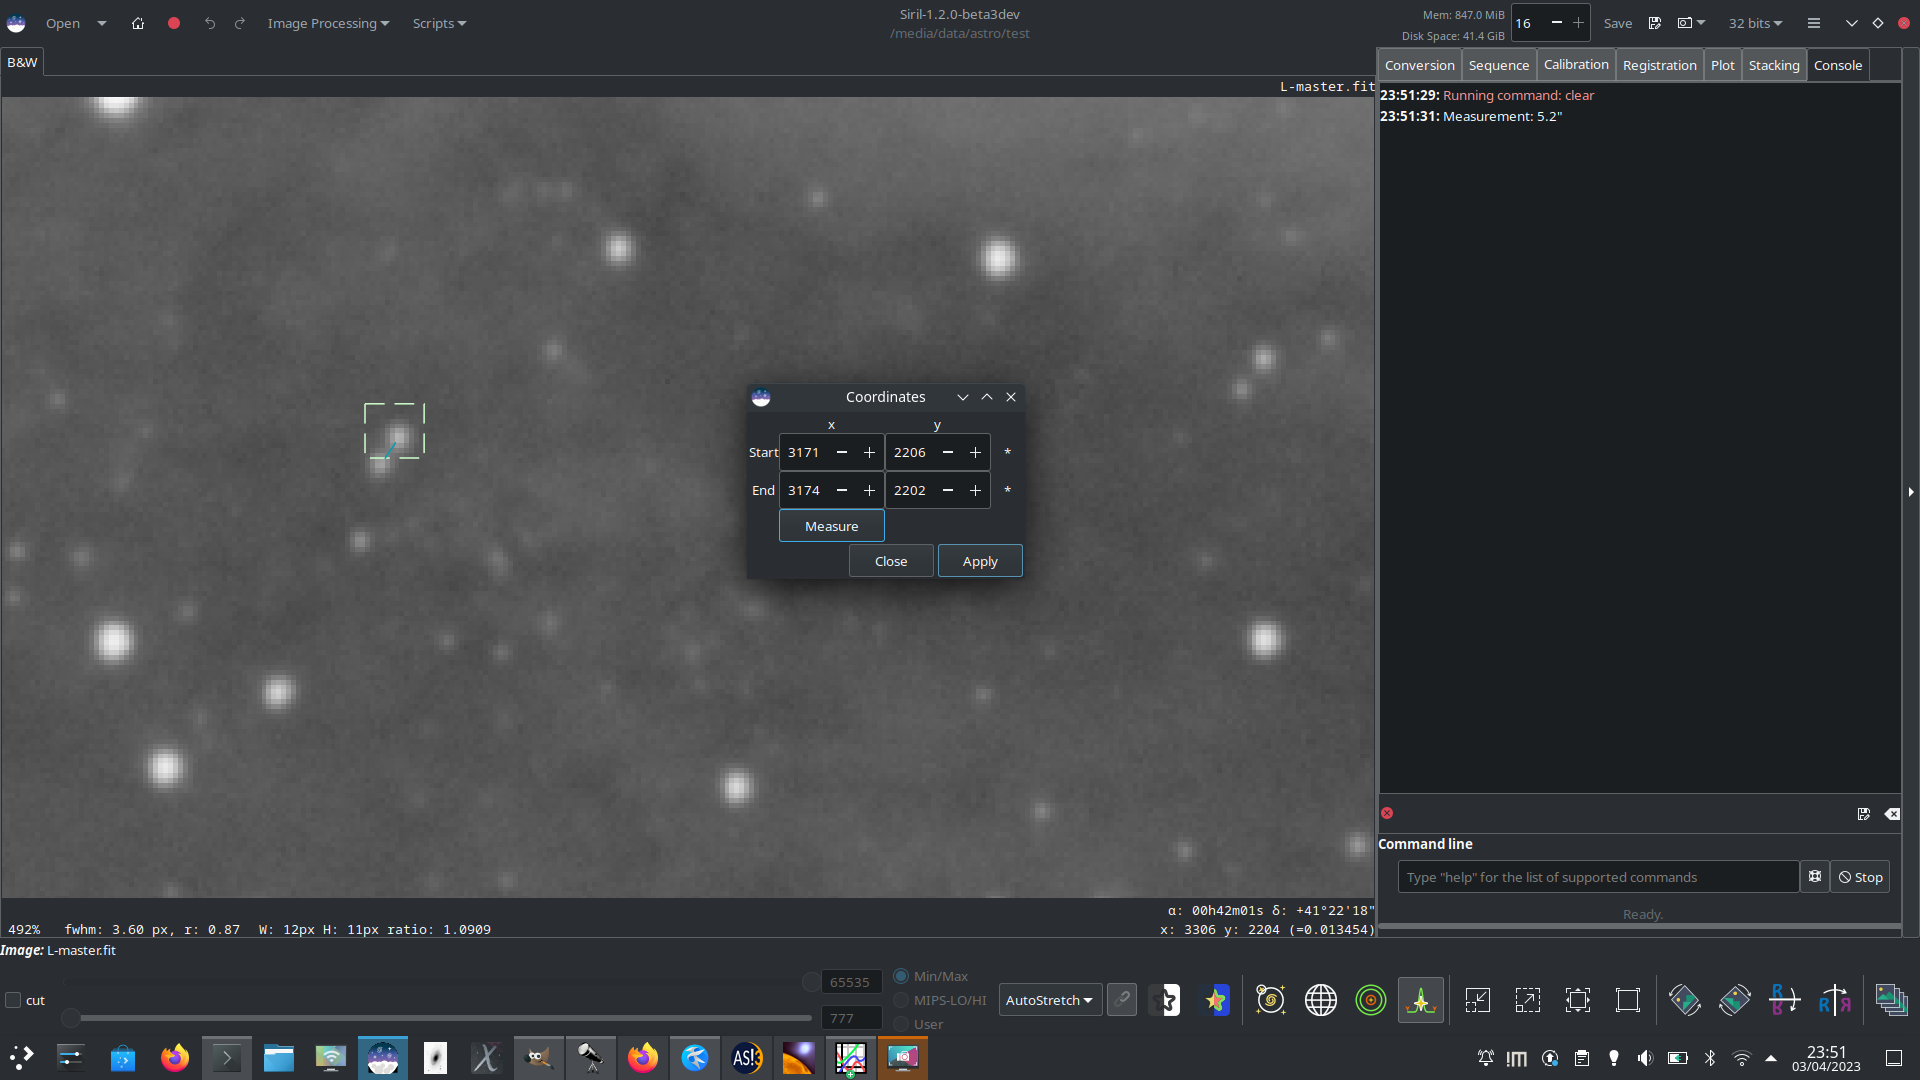
Here, two close stars have been selected and set as the endpoints and the separation between them measured as 5.2 arcsec. This could be used to study close binaries or to triangulate the position of a minor planet.
注釈
Siril's measurement function makes the small angle approximation for the angular separation \(\theta\). The most significant error term is proportional to \(\theta^3\) and is less than 1% for measurements up to 10°: it is therefore valid for most astrometric uses, but will become inaccurate for large measurements across ultra-wide field images. A warning will be written to the log for measurements over 10°.
Sirilプロットツール
プロファイル機能は、さまざまなプロファイルを表示するためにSiril内部プロットツールを使用します。生成された *.dat ファイルを使用して、お好みのプロットツールを使用して、基礎となるデータを探索できます。
グラフの任意の場所で 右-クリック すると、コンテキストメニューがポップアップします:
グリッドと凡例を表示する/表示しない
現在のビューをクリップボード、
*.pngまたは*.svgに書き出す基礎となるデータを
*.datファイルに保存する
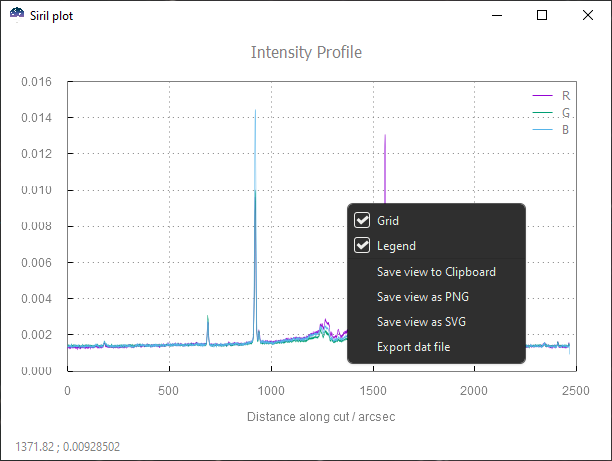
Sirilプロットコンテキストメニュー
すべてのエクスポートは、現在のズーム/パンを考慮する一方、datに保存するとフィルタリングされていないデータがエクスポートされることに注意してください。
以下のGUI操作が利用可能です:
クリック+ドラッグ で選択範囲を描画します。マウスを離すとズームが選択範囲に設定されます。
Ctrl+ドラッグ で現在のビューを平行移動します。
Ctrl+スクロール でズームイン/アウトします。
ダブルクリック すると、デフォルトの位置/ズームにリセットされます。
コマンド
Sirilコマンドライン
profile -from=x,y -to=x,y [-tri] [-cfa] [-arcsec] { [-savedat] | [-filename=] } [-layer=] [-width=] [-spacing=] ["-title=My Plot"]
Sirilコマンドライン
seqprofile sequence -from=x,y -to=x,y [-tri] [-cfa] [-arcsec] [-savedat] [-layer=] [-width=] [-spacing=] [ {-xaxis=wavelength | -xaxis=wavenumber } ] [{-wavenumber1= | -wavelength1=} -wn1at=x,y {-wavenumber2= | -wavelength2=} -wn2at=x,y] ["-title=My Plot"]