Histogram Overlay
The histogram overlay provides real-time visualization of your image's tonal distribution directly on the image canvas, allowing you to monitor intensity levels while performing adjustments.
Activating the Histogram Overlay
The histogram overlay can be toggled on and off using either of these methods:
Click the Histogram button in the main toolbar
Press Ctrl+H (or Cmd+H on macOS)
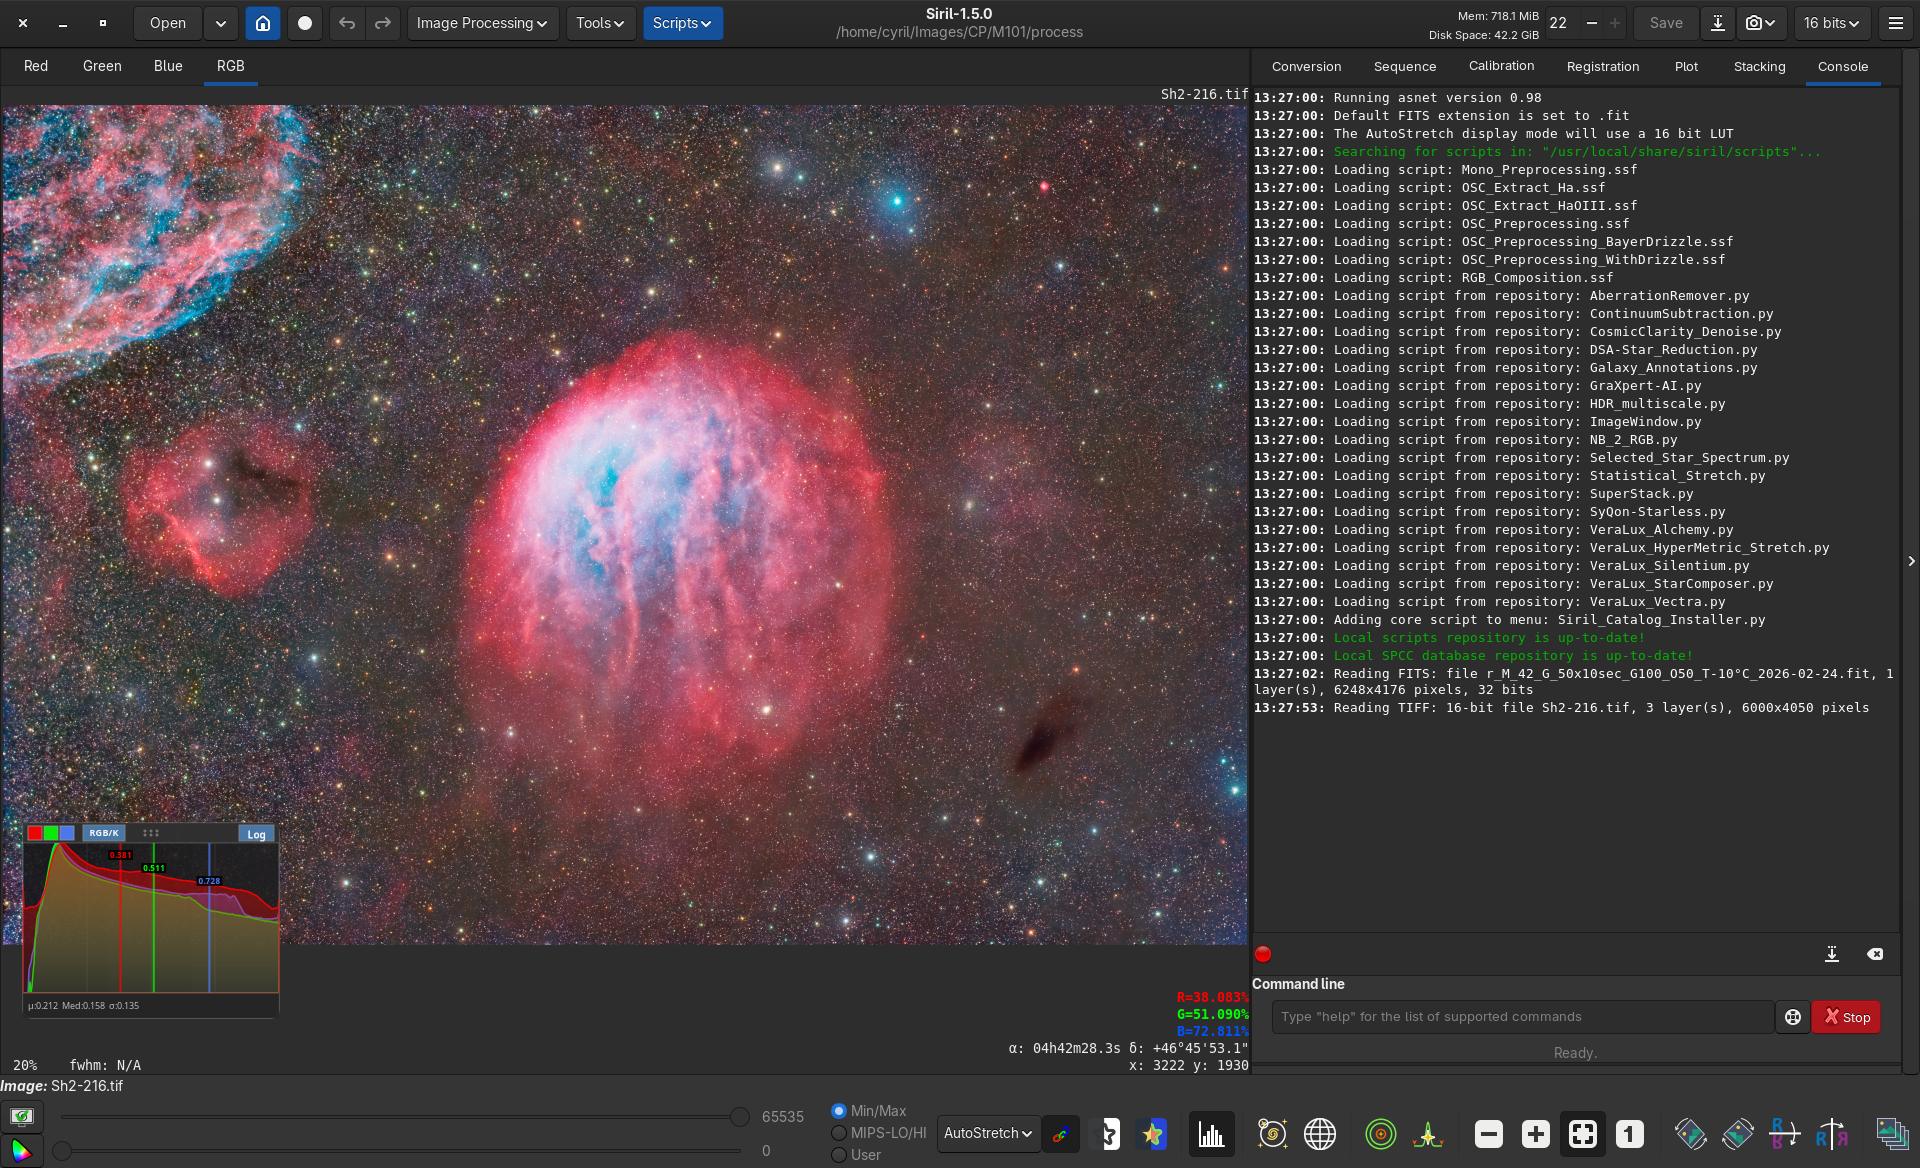
The histogram overlay showing RGB channel distribution on an image
Features
Channel Display
The histogram overlay displays the tonal distribution for each color channel:
Red channel - Displayed in red
Green channel - Displayed in green
Blue channel - Displayed in blue
Monochrome images - Displayed in white
For color images, all three RGB channels are shown simultaneously with their respective colors, making it easy to identify color balance and clipping issues.
Logarithmic Scale
The histogram automatically adapts to display data in logarithmic scale when appropriate, revealing detail in both shadow and highlight regions that might otherwise be difficult to see in a linear scale. The default display is based on the settings defined in Siril’s preferences.
Statistics Display
Below the histogram curves, you'll find statistical information about your image:
Minimum value (μ) - The darkest pixel value in the image
Median value (Med) - The middle value of the tonal distribution
Standard deviation (σ) - A measure of the spread of values
These statistics are displayed with high precision and update in real-time as you make adjustments to your image.
Use Cases
The histogram overlay is particularly useful when:
Stretching images - Monitor clipping in real-time during histogram transformation
Color balancing - Observe how color corrections affect each channel's distribution
Assessing exposure - Quickly identify if an image is under- or over-exposed
Calibration review - Verify that calibration frames are producing the expected tonal distribution
Tips
The overlay remains visible across different image processing operations, allowing continuous monitoring of your adjustments
The histogram automatically updates when you switch between images or modify the current image
For best visibility, the overlay is rendered with semi-transparency to avoid obscuring important image details